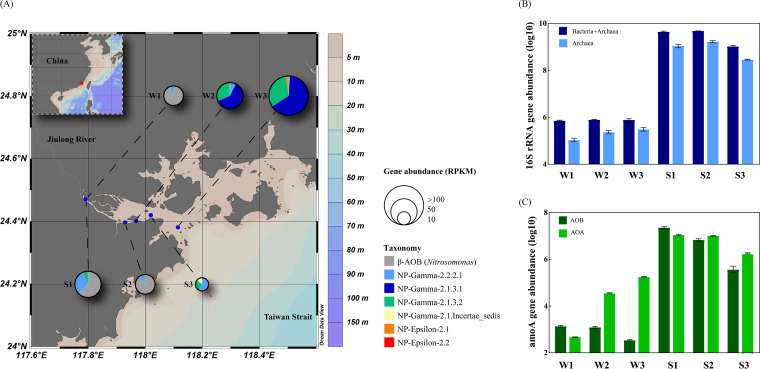
FIG 1.
(A) Relative abundances and community compositions of amoA genes at the sampling stations based on metagenomic sequences. (B and C) Quantified abundances (log10) of total bacterial and archaeal 16S rRNA genes (B) and bacterial and archaeal amoA genes (C) in samples. The maps were created using Ocean Data View software.

