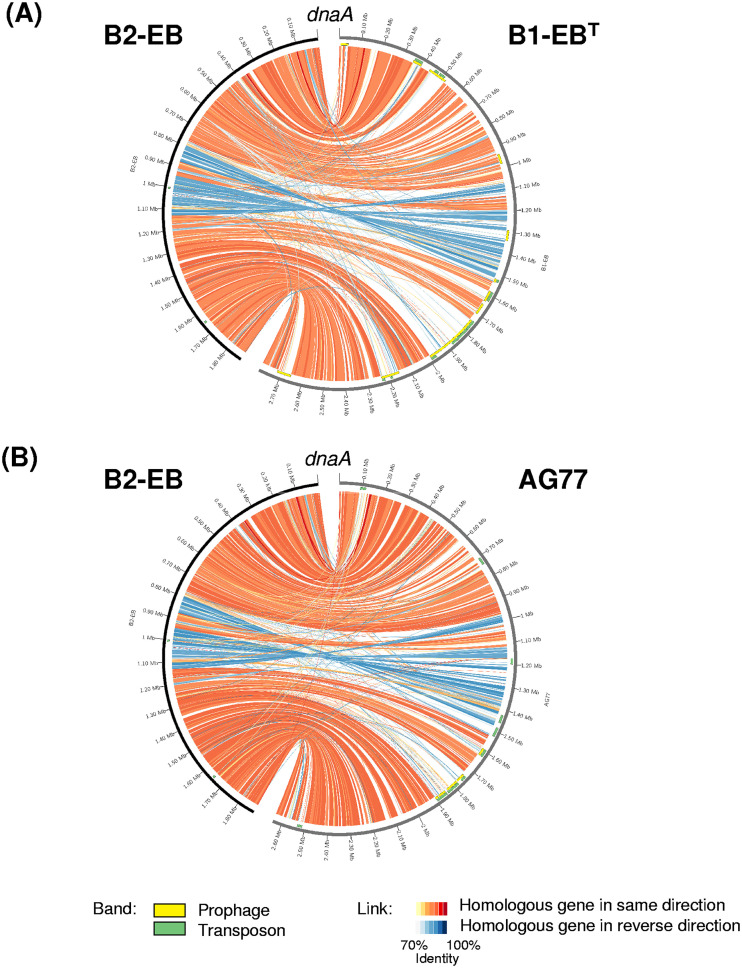
FIG 5.
Syntenic comparative genomic analysis of Mycoavidus sp. B2-EB with M. cysteinexigens B1-EBT (A) and AG77 (B). Green and yellow bands next to the scale show the positions of transposons and prophages, respectively. Red and blue links associated with the two genomes show homologous genes in same and reverse directions, respectively. The gradient color of the link shows the nucleotide identity between the homologous genes.

