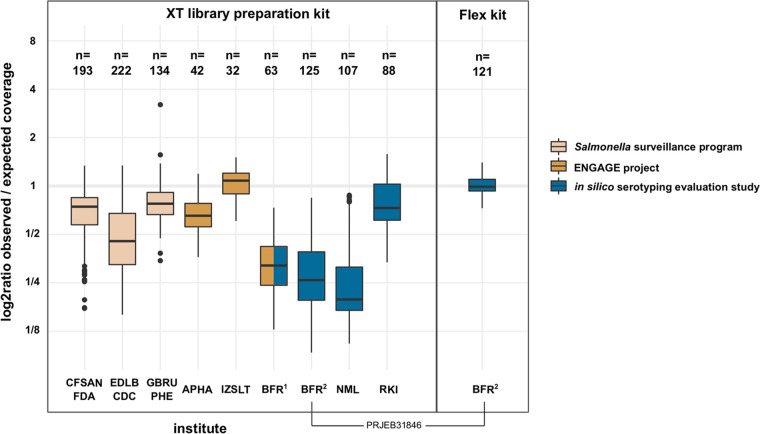
FIG 1.
Comparison of GC-associated coverage bias between sequence data from different institutes. Sequence data of major Salmonella serovars (Agona, Bareilly, Berta, Braenderup, Brandenburg, Cerro, Choleraesuis, Corvallis, Derby, Dublin, Enteritidis, Gallinarum, Give, Goldcoast, Hadar, Heidelberg, Indiana, Infantis, Java, Javiana, Johannesburg, Kentucky, Manhattan, Mbandaka, Mikawasima, Montevideo, Muenchen, Muenster, Newport, Ohio, Oranienburg, Panama, Pullorum, Rissen, Saintpaul, Schwarzengrund, Senftenberg, Stanleyville, Tennessee, Thompson, Typhimurium, Virchow, Waycross, Worthington) were randomly sampled from 13 BioProjects: Center for Food Safety and Applied Nutrition, Food and Drug Administration (United States) (CFSAN-FDA), PRJNA186035; Enteric Diseases Laboratory Branch, Centers for Disease Control and Prevention (United States) (EDLB-CDC), PRJNA230403; Gastrointestinal Bacteria Reference Unit, Public Health England (United Kingdom) (GBRU-PHE), PRJNA248792; Animal and Plant Health Agency (United Kingdom) (APHA), PRJEB24097, PRJEB24103, PRJEB24107, and PRJEB24311; Istituto Zooprofilattico Sperimentale del Lazio e la Toscana (Italy) (IZSLT), PRJEB23728 and PRJEB23778; German Federal Institute for Risk Assessment, PRJEB23094 (BFR1) and PRJEB31846 (BFR2); National Microbiology Laboratory (Canada) (NML), PRJNA353625; and Robert Koch-Institut (Germany) (RKI), PRJEB30317. The total number of isolates sampled per data set is displayed above each box plot. The type of Nextera sequencing library preparation kit is indicated (left, XT; right, Flex). Fill colors indicate the type of sequencing project.

