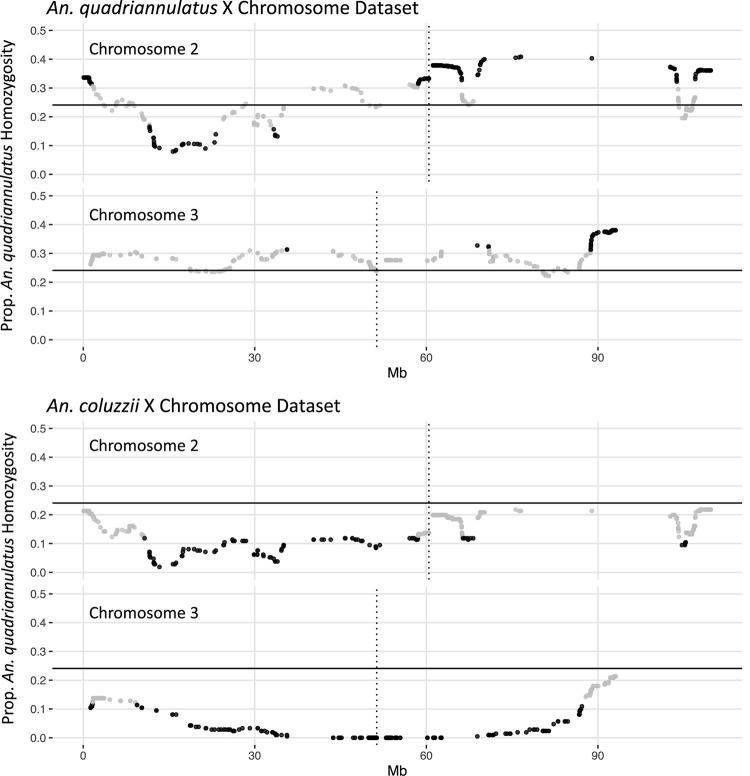
FIGURE 2.
Segregation distortion at chromosome 2 and 3 loci for the An. quadriannulatus X chromosome (top) and An. coluzii X chromosome dataset (bottom). Gray dots indicate SNPs that do not deviate significantly from the expected proportion of homozygosity (solid horizontal line), while black dots deviate significantly (chi-square p < 0.05). Vertical dotted lines indicate centromere locations.

