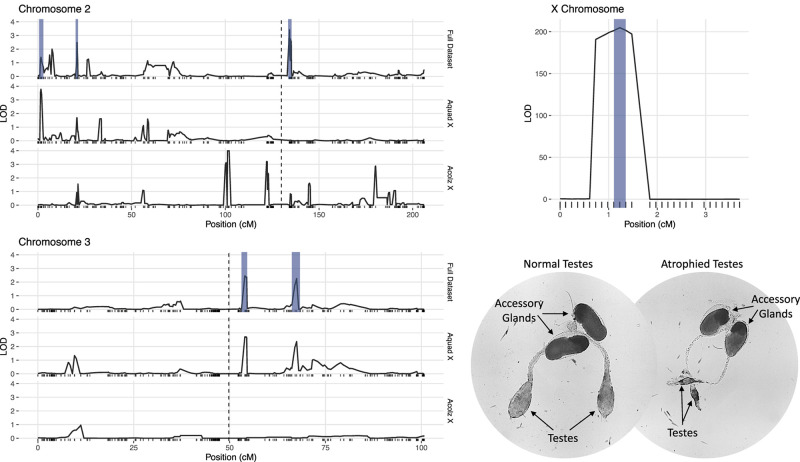
FIGURE 3.
LOD plots for hybrid male sterility QTL identified with composite interval mapping in the An. coluzzii × An. quadriannulatus cross. Note the differences in the y-axis scales between the chromosome 2 (top left) and 3 (bottom left) panels, and the X chromosome panel (top right). Vertical, dashed lines indicate centromere locations on chromosomes 2 and 3. Second and third chromosome right arms are left of the centromere, and left arms are to the right. Vertical blue bars indicate 1.5 LOD intervals of QTL that explain a significant proportion of phenotypic variation in multiple imputation QTL model of the full dataset. The bottom right panel illustrates the gross morphological differences between hybrid testes with a normal sterility score (1) and a atrophied hybrid testes (sterility score = 6) which contain no sperm or only a few sperm with abnormal morphology.

