
Figure 3. OFC Closed-Loop Theta Stimulation Disrupts Value Learning.
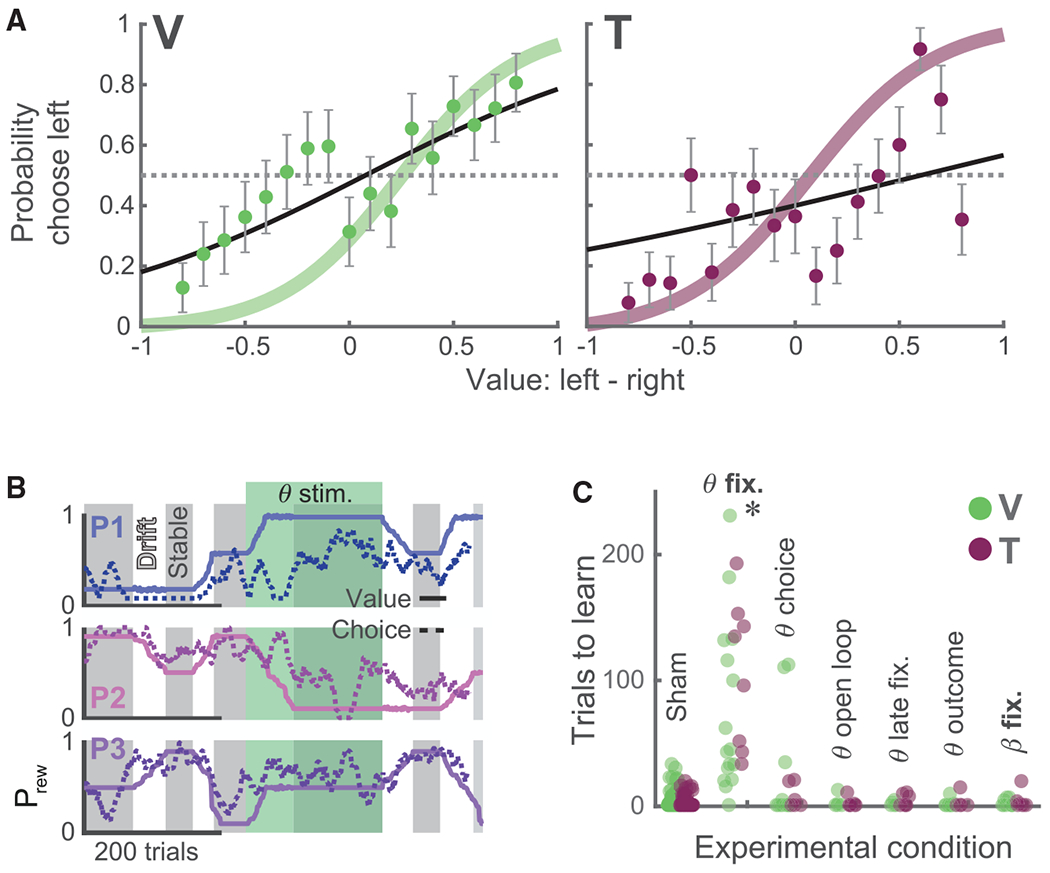
(A) The probability of each subject choosing the left option as a function of the relative difference in left and right values during theta fixation stimulation sessions (subject V, 2,251 trials in 6 sessions; subject T, 1,012 trials in 3 sessions). Convention follows Figure 1C. A colored line denotes mean ± SEM of logistic fit from baseline behavior. Curves are flattened relative to baseline behavior, indicating that subjects’ choices are less well predicted by the relative value of the pictures.
(B) Example session showing the effect of theta stimulation on learning (subject V). Convention follows Figure 1B. A green-shaded region indicates trials where theta-fixation stimulation was delivered.
(C) Number of trials required to reach criterion performance during stimulation. Each point denotes one stimulation block. Only theta stimulation during the fixation epoch significantly impaired learning (*p < 0.0005 in both subjects, rank-sum test, experimental conditions versus sham stimulation, corrected for multiple comparisons).