
Figure 4. Effect of Stimulation on LFP.
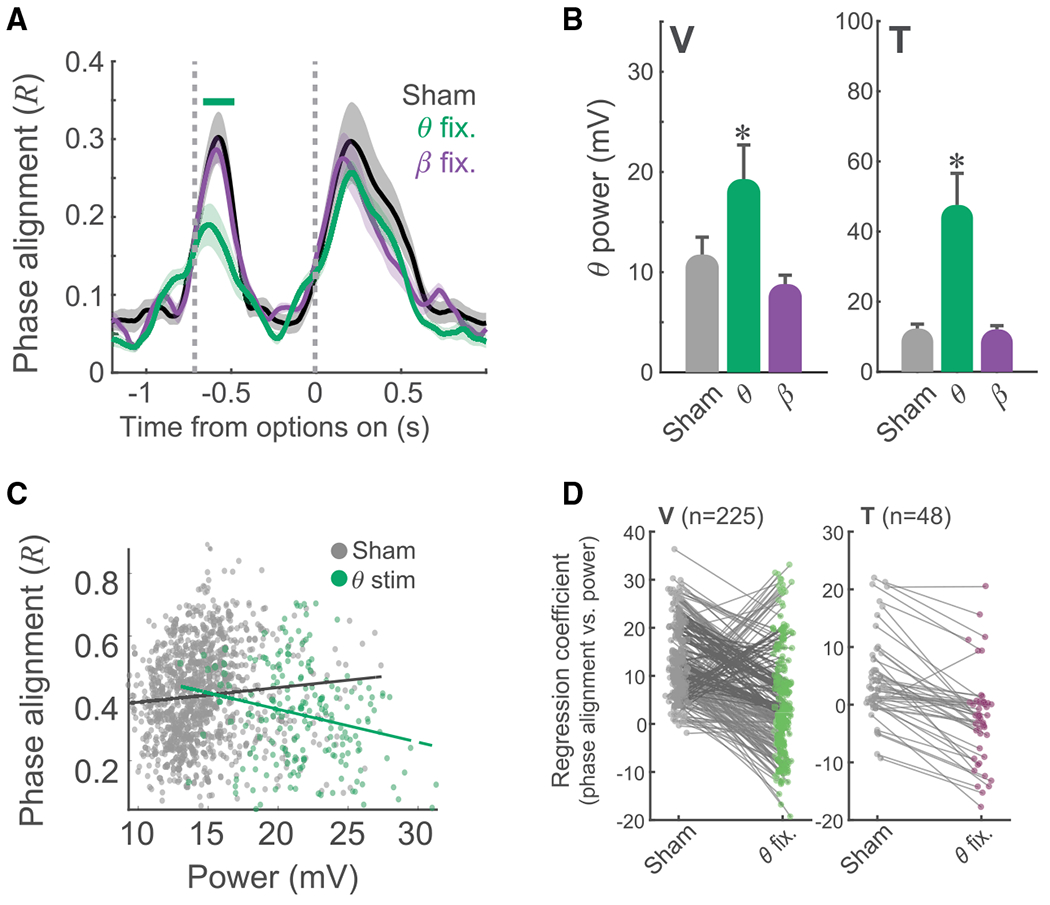
(A) Mean cross-trial theta phase alignment (R) for sham (black), theta (green), and beta (purple) stimulation sessions in subject V. Significant differences were assessed with a sliding 1-way ANOVA evaluated at p < 0.01. A green horizontal line indicates when the cross-trial theta phase alignment was significantly lower during theta stimulation compared with either sham or beta stimulation.
(B) Mean theta power during the fixation epoch as a function of stimulation type.
(C) Single-channel example of the effect of stimulation on the power-phase relationship. Points in gray denote sham trials, and points in green represent stimulation trials. Theta stimulation increased theta power and decreased cross-trial theta phase alignment.
(D) Population data from both subjects, summarizing the phase-power relationship for each OFC electrode. Theta stimulation shifted the power-phase relationship from positive to negative.