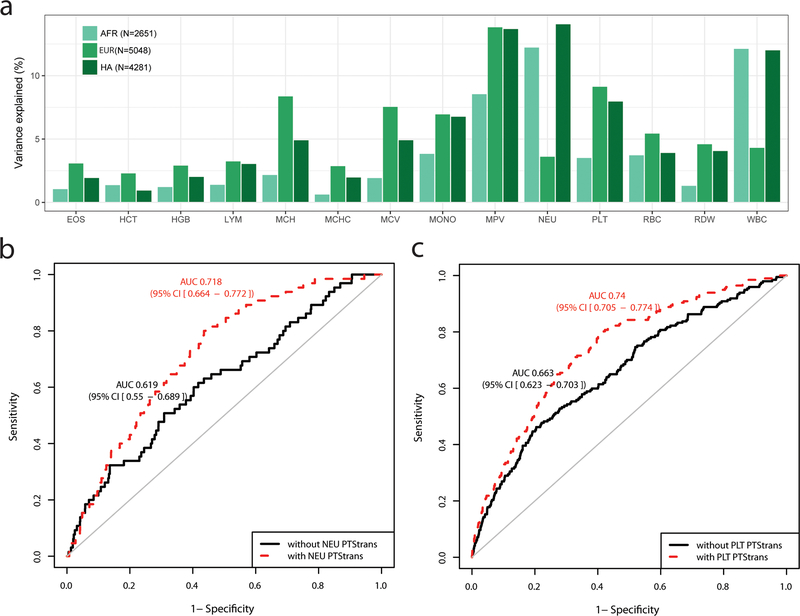
Figure 4.
Phenotypic variance and hematological disease prediction using polygenic trait scores (PTS) in independent participants from the BioMe Biobank. (a) For each blood-cell trait, PTStrans were calculated using genome-wide significant variants identified in the trans-ethnic meta-analyses. Trait-increasing alleles were weighted using effect sizes derived from fixed-effect trans-ethnic meta-analyses. (b) Receiver operating characteristic (ROC) curve and area under the curve (AUC and 95% confidence interval) for neutropenia (defined as <1500 NEU/mL) in BioMe participants of African-ancestry without (black) or with (red) the PTStrans for neutrophil count in the predictive model. Age, sex, and the first 10 principal components were used in the basic prediction model. (c) As for b, but for thrombocytopenia (defined as <150×109 PLT/L) and the PTStrans for platelet count in Hispanic participants from BioMe. See also Figure S5 and Table S4B–C.

