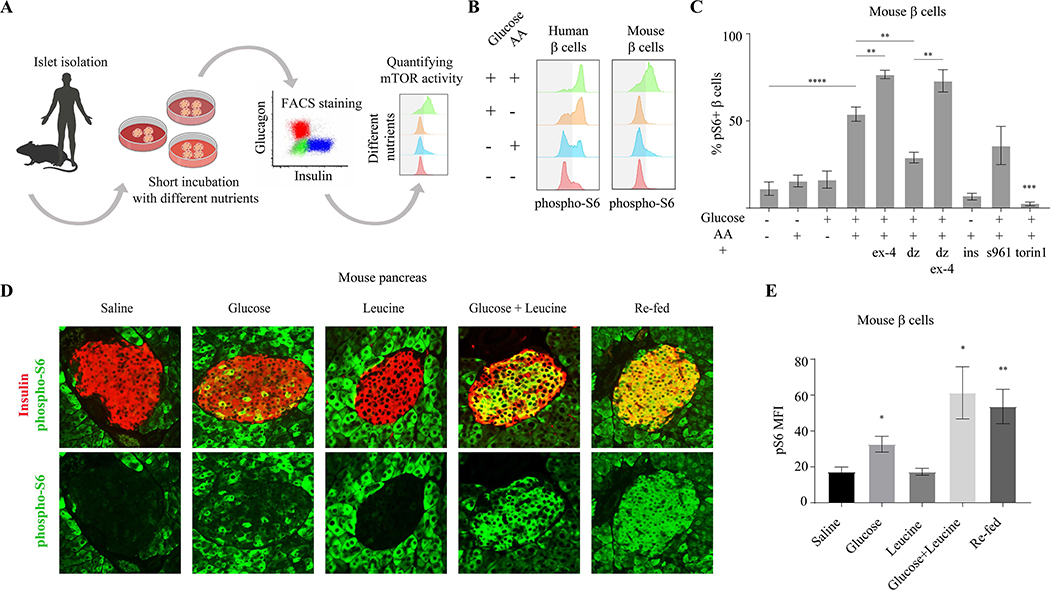
Figure 3.
mTORC1 activity in mature β cells is dynamic and regulated by nutrients. (A) Schematic representation of experimental method to quantify mTORC1 activity in β cells. (B) Representative p-S6 staining histograms of insulin+ cells from adult human (left) and mouse (right) islets, detected by FACS analysis compared to secondary antibodies only control. (C) Percentages of p-S6 positive β cells in mouse islets, after 30 minutes incubation in the indicated conditions, detected by FACS compared to secondary antibodies only control. n=10, 7, 6, 10, 4, 4, 3, 3, 3, 3 biological replicates; left to right. Data points represent mean ± SEM. P values, * P<0.05, ** P<0.01, *** P<0.001, **** P<0.0001, unpaired Student’s t test. S961- insulin receptor antagonist, torin1- mTOR inhibitor. (D) Representative immunostainings of p-S6 (green) and insulin (labeling β cells, blue), in pancreatic islets of fasted mice injected with the indicated nutrients or re-fed. (E) Mean fluorescent intensity (MFI) of p-S6 staining in islets of mice injected with indicated nutrients or re-fed, n=4 for each condition. Data points represent mean ± SEM. P-values, * P<0.05, ** P<0.01, unpaired Student’s t test.

