Figure 4.
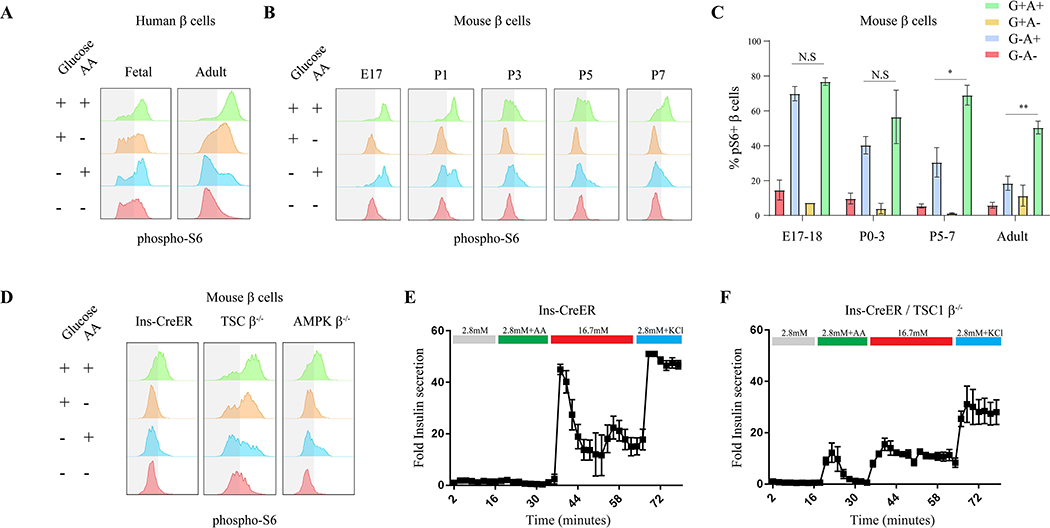
A neonatal shift in mTORC1 nutrient sensitivity controls β cell function. (A) Representative p-S6 FACS staining histograms of c-peptide+ cells from fetal (left column) and adult (right column) human subjects, following 30 minutes incubation of human islets in RPMI with indicated nutrients. Experiment was repeated three times on three different samples of fetal human pancreas from embryonic days 90, 92 and 120. (B) Representative p-S6 staining histograms of insulin+ cells from mice of indicated age following 30 minutes incubation of islets in RPMI with indicated nutrients. Note that at P7 mTORC1 dynamics is equivalent to mature β cells. (C) Percentages of p-S6 positive β cells from mice of indicated age in response to indicated nutrients, detected by FACS analysis compared to secondary antibodies only control. Data points represent mean ± SEM. P-values, * P<0.05, ** P<0.01, *** P<0.001, unpaired Student’s t test. n=3, 3, 3, 4 biological replicates; left to right. Control of mTORC1 dynamics affects insulin secretion in mature β cells. (D) Representative p-S6 staining histograms of insulin+ cells of Ins-CreER (left column) AMPK and TSC deficient (β cell-specific) mice following 30 minutes incubation of mouse islets in RPMI with indicated nutrients. (E-F) Fold insulin levels secreted by isolated islets from Ins-CreER (E, n=4) and TSC knockout (F, n=4) β cells, in a dynamic GSIS assay in low (2.8 mM, grey line), amino acids (green), high (16.7 mM, red) glucose concentrations and KCl (30 mM, blue). Note the increased insulin secretion in response to amino acids in β cells with perturbed mTORC1 activity.

