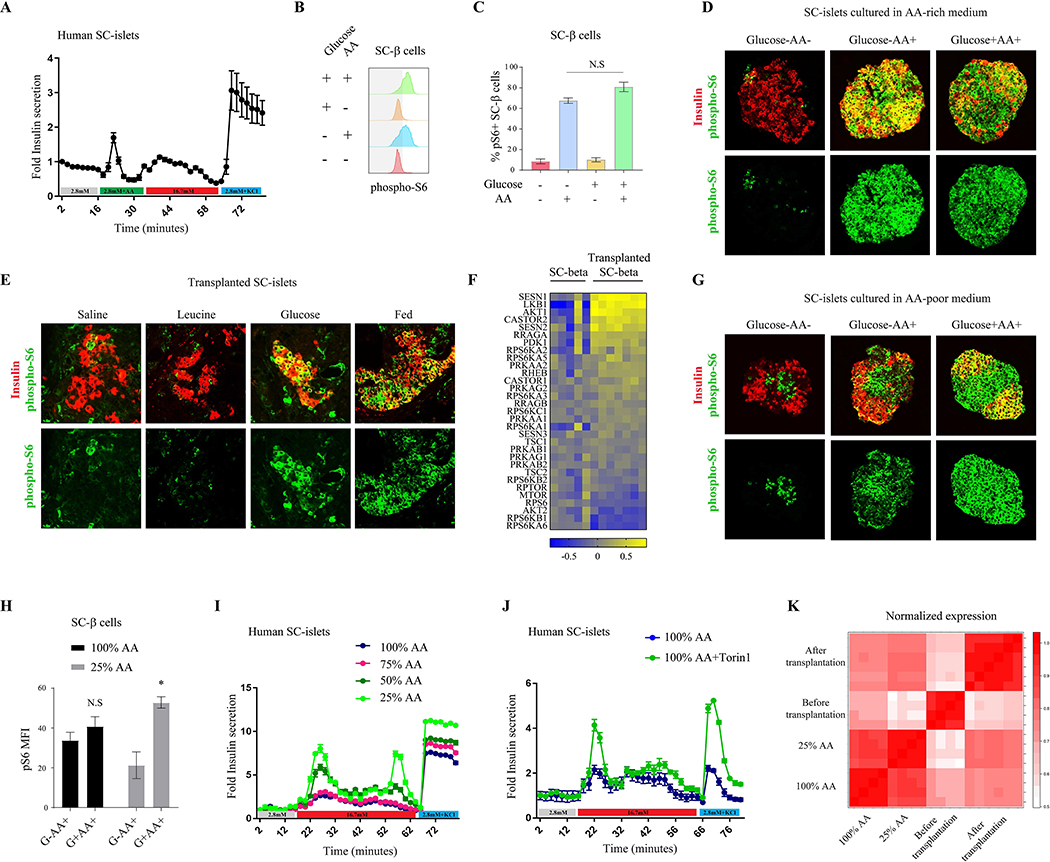
Figure 5.
A shift in mTORC1 nutrient sensitivity dictates SC-β cell function. (A) Fold insulin levels secreted by isolated islets from SC-β cells (n=6), in a dynamic GSIS assay in low (2.8 mM, grey line), amino acids (green), high (16.7 mM, red) glucose concentrations and KCl (30 mM, blue). Note the insulin secretion in response to amino acids in SC-β cells. (B) Representative p-S6 staining histograms of c-peptide+ cells (SC-β cells) and (C) Percentages of p-S6 positive SC-β cells detected by FACS analysis following 30 minutes incubation of SC-clusters in RPMI with indicated nutrients. Note the strong mTORC1 response of SC-β cells to amino acids only. n=9 biological replicates. (D) Representative immunostainings of p-S6 (green), and c-peptide (labeling SC-β cells, red), in clusters of in-vitro differentiated stem cells grown in an amino acid-rich media and incubated for 30 minutes with indicated nutrients. (E) Representative immunostainings of p-S6 (green) and c-peptide (labeling SC-β cells, blue), in kidney capsule-transplants of SC-β cells. Transplanted mice were fasted overnight and injected with the indicated nutrients or re-fed. Note the weak response of mTORC1 to leucine and the acquired glucose responsiveness 12 days after transplantation. Experiment was conducted with similar results 12 days, 18 days and 4 weeks after transplantation (n=6). (F) Gene expression heat map of known regulators of mTORC1 signaling in SC-β cells four weeks after transplantation under the kidney capsule of mice, normalized to expression levels of the genes in SC-β cells before transplantation. SC-β cells were sorted from five independent differentiation flasks and seven transplanted mice. (G) Representative immunostainings of p-S6 (green), and c-peptide (labeling SC-β cells, red), in clusters of in-vitro differentiated stem cells grown in an amino acid-poor media and incubated for 30 minutes with indicated nutrients. (H) Mean fluorescent intensity (MFI) of p-S6 staining in SC-β cells from indicated conditions, n=4 for each condition. Data points represent mean ± SEM. P-values, * P<0.05, unpaired Student’s t test. (I) Insulin levels secreted by SC-β cells from indicated growing condition in a dynamic perfusion assay in low (2.8 mM, grey line), high (16.7 mM, red) glucose concentrations and KCl (30mM, blue line). Secreted insulin levels were normalized to basal insulin secretion of each sample. The experiments with all conditions were done on six independent differentiation flasks. (J) Insulin levels secreted by SC-β cells from amino acid-rich media (100% AA), with (green) or without (blue) Torin1, in a dynamic perfusion assay in low (2.8 mM, grey line) and high (16.7 mM, red line) glucose concentrations and KCl (30mM, blue line). Secreted insulin levels were normalized to basal insulin secretion of each sample. Experiment was done on three independent differentiation flasks. (K) Correlation heat map presenting data from two different experiments; SC-β cells before and after transplantation and SC-β cells cultured in different concentrations of AA (100% and 25% of total amino acids in the rich-media).

