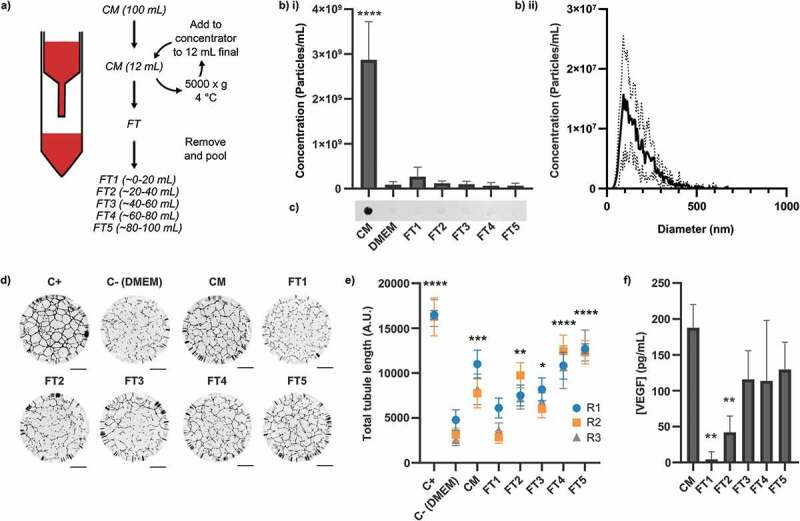
Figure 1.

Contents and signalling properties of hMSC-conditioned medium after 100 kDa ultrafiltration. Media (CM) was passed through a 100 kDa membrane and collected in sequential ~20 mL batches (FT1-5), as described in the main text. (a) Schematic of experimental workflow. CM = Conditioned medium, FT = Flowthrough. (b) NTA measurements of i) concentration and ii) size distribution (of CM sample), N = 3, n = 3 x 60s videos, mean ± SD shown. Particles were only detected in CM (1-way within-subjects ANOVA and post-hoc Dunnett’s test vs DMEM control). (c) Dot blots against CD63. CD63 was only detected in CM. Independently prepared replicate samples were blotted onto the same membrane and analysed simultaneously (N = 3, representative blot shown). (d) Representative whole-well images of tubule structures. Images inverted for clarity. Scale bar = 1 mm. (e) Quantification of total tubule length in tubule formation assay. All samples besides FT1 had a greater proangiogenic activity than DMEM (N = 3, n = 12, mean ± SD of n shown for each N (replicates 1–3, R1-3), 1-way within-subjects ANOVA and post-hoc Dunnett’s test vs DMEM control). (f) ELISA against VEGF. VEGF was reduced relative to the level in CM in FT1 and FT2 only (N = 3, n = 2, mean ± SD shown, 1-way within-subjects ANOVA and post-hoc Dunnett’s test vs CM). *: p < 0.05, **: p < 0.01, ***: p < 0.001, ****: p < 0.0001.
