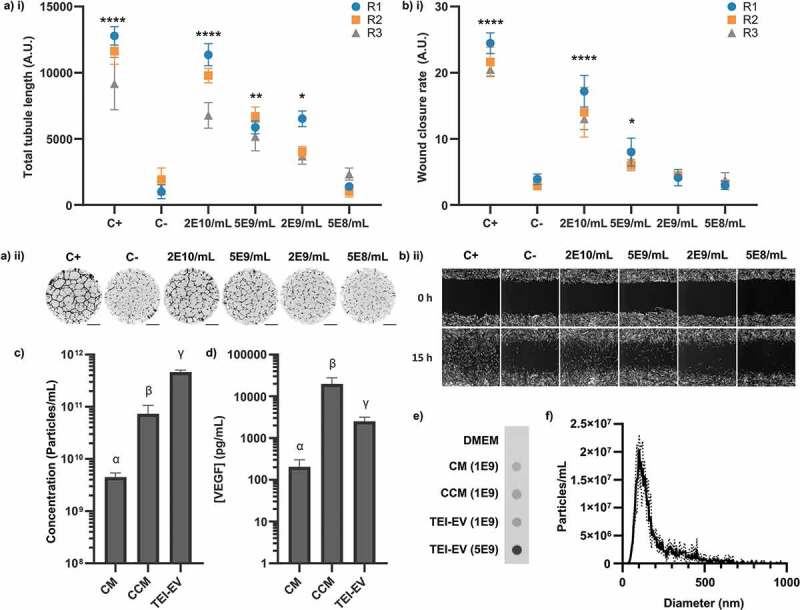
Figure 5.

Biological activity of TEI-isolated hMSC-EVs. (a) i) Quantification of total tubule length in tubule formation assay stimulated by different TEI-EV concentrations. (N = 3, n = 12, mean ± SD of n shown for each N (replicates 1–3, R1-3). (a) ii) Representative whole-well images of tubule structures formed in (a) i). Images inverted for clarity. Scale bar = 1 mm. (b) i) Quantification of wound closure rate stimulated by different TEI-EV concentrations. (N = 3, n = 3, mean ± SD shown for each N (replicates 1–3, R1-3)). (b) ii) Representative images of scratch wounds are shown for t = 0 and t = 15 h. Scale bar = 100 μm. *: p < 0.05, **: p < 0.01, ***: p < 0.001, ****: p < 0.0001, (one-way within-subjects ANOVA and post-hoc Dunnett’s test vs C-). (c) Particle concentrations (as measured by NTA) in each sample (N = 3, n = 3 x 60s videos, mean ± SD shown). (d) VEGF concentrations (as measured by ELISA) in each sample (N = 3, n = 2, mean ± SD shown). Samples in (c) and (d) are significantly different unless they share a letter (p < 0.05, one-way within-subjects ANOVA and post-hoc Tukey’s HSD test). Where plotted on a logarithmic axis, data were log10-transformed prior to statistical analysis. (e) Dot blot against CD63 for CM, concentrated CM (CCM) and TEI-EV samples Number denotes NTA-quantified particles loaded. (N = 3, one representative image shown). CD63 is present in all samples. (f) Size distribution of TEI-EV as measured by NTA (N = 3, n = 3 x 60s videos, mean ± SD shown) (same dataset as (c)).
