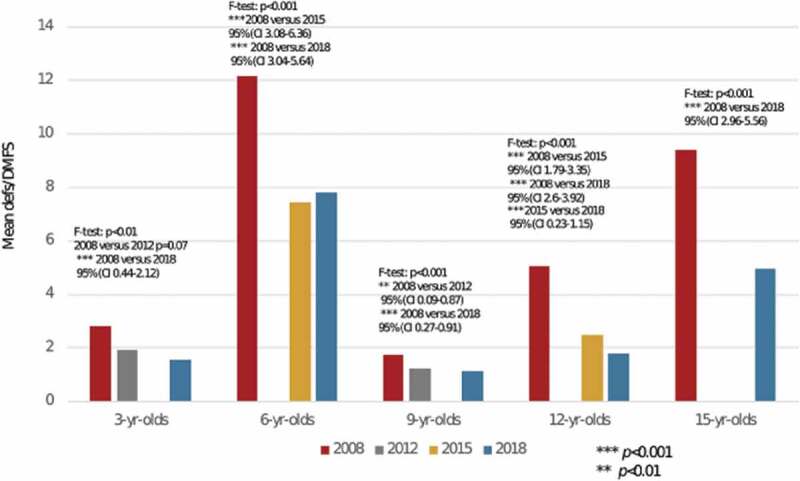
Figure 1.

Shows the mean defs/DMFS in the 5 age groups related to 2008, 2012/2015 and in 2018. Statistics as F-test: p < 0.01; p < 0.001; post hoc test ***p < 0.001; **p < 0.01 and 95% CI are shown. Only those comparisons where the difference was significant were given.
