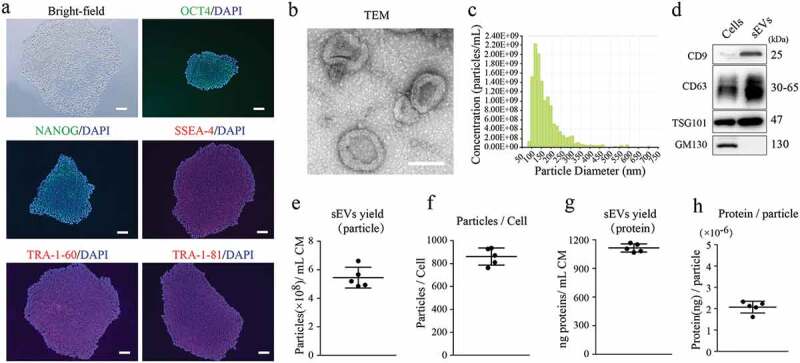
Figure 1.

Characterization of hESCs and hESC-sEVs.
(a) Representative bright-field image and OCT4, NANOG, SSEA-4, TRA-1-60, TRA-1-81 immunostaining micrographs of hESCs. Nucleus was stained with DAPI. Scale bar, 50 μm. (b) Representative TEM images of hESC-sEVs. Scale bar, 100 nm. (c) Average particle size distribution and concentration of hESC-sEVs measured by qNano. (d) Representative western blot analysis showing the presence of exosomal markers including CD9, CD63, and TSG101, but negative for GM130 in hESC-sEVs. (e,f) Evaluation of hESC-sEVs yield in term of particle concentration. (g,h) Evaluation of hESC-sEVs yield in term of protein concentration. Each experiment was repeated three to five times independently. Data are represented as mean±s.e.m.
