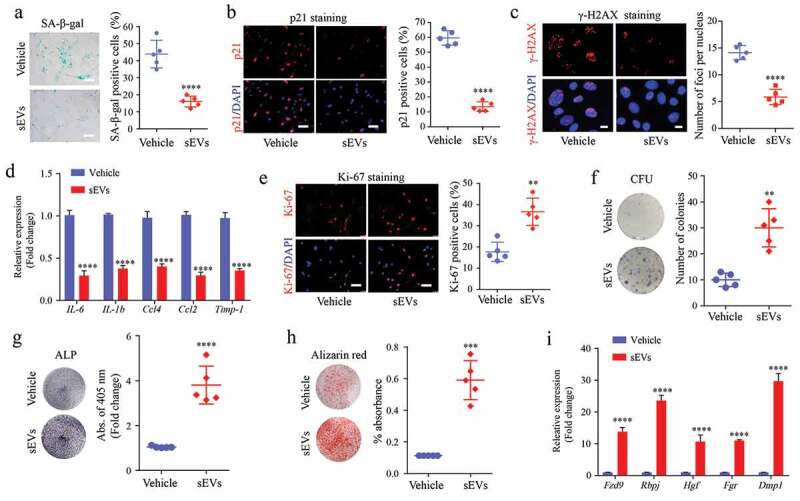
Figure 3.

hESC-sEVs ameliorate the senescent phenotypes, and promote the proliferation and osteogenic differentiation of BM-MSCs in vivo.
(a) SA-β-gal staining of BM-MSCs from vehicle- or sEV-treated mice. Left panel, representative pictures of SA-β-gal staining. Right panel, quantification of SA-β-gal positive BM-MSCs. Scale bar, 50 μm. (b) P21 immunostaining of BM-MSCs. Left panel, representative pictures of P21 immunostaining. Right panel, quantification of P21 positive BM-MSCs. Scale bar, 50 μm. (c) γ-H2AX immunostaining of BM-MSCs. Left panel, representative pictures of γ-H2AX immunostaining. Right panel, quantification of foci per nucleus. Scale bar, 10 μm. (d) RT-qPCR analysis of SASP-related gene expression in BM-MSCs. (e) Ki67 immunostaining of BM-MSCs from vehicle- or sEVs-treated mice. Left, representative pictures of Ki67 immunostaining. Right, quantification of Ki67 positive BM-MSCs. Scale bar, 50 μm. (f) Crystal violet staining for the CFU colonies of BM-MSCs from vehicle- or sEVs-treated mice. Left, representative pictures of crystal violet staining. Right, quantification of the number of CFU colonies. (g) ALP staining of BM-MSCs from vehicle- or sEVs-treated mice after osteogenic induction. Left, representative pictures of ALP staining. Right, quantification of ALP activity. (h) Alizarin red staining of BM-MSCs from vehicle- or sEVs-treated mice after osteogenic induction. Left, representative pictures Alizarin red staining. Right, quantification of mineralized absorbance. (i) RT-qPCR analysis of osteogenic gene expression in BM-MSCs. Each experiment was repeated three times independently. Data from n = 5 independent samples per group are represented. P-value is indicated as sEVs group versus vehicle group. *P < 0.05, **P < 0.01, ***P < 0.001, ****P < 0.0001.
