Figure 5.

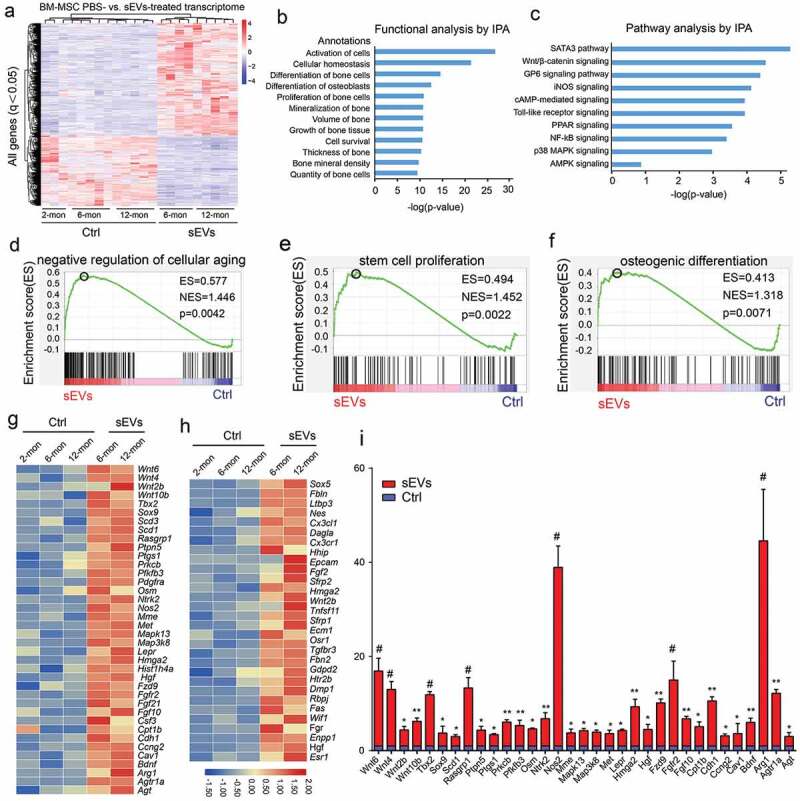
Identification of BM-MSCs transcriptome changes after hESC-sEVs treatment by RNA-seq.
(a). Heatmap representing the hierarchical clustering of significant differential expression genes in different aged BM-MSCs treated with hESC-sEVs. (b). IPA exhibiting the functional classification of differentially expressed genes in BM-MSCs. (c). IPA showing canonical pathways of the differentially expressed genes in BM-MSCs. (d-f) GSEA analysis identifies enrichment score for modules of negative regulation of cellular ageing (d), stem cell proliferation (e), and osteogenic differentiation (f) in BM-MSCs after hESC-sEVs treatment. (g,h) Heatmap representation of differentially expressed genes (fold change >2) in the GSEA analysis associated with negative regulation of cellular ageing (g), stem cell proliferation and osteogenic differentiation (h). (i) RT-qPCR analysis of anti-ageing gene expression in BM-MSCs treated with hESC-sEVs. The experiment was repeated three times independently. P-value is indicated as sEV group versus ctrl group. *P < 0.05, **P < 0.01, ***P < 0.001, #P < 0.0001.
