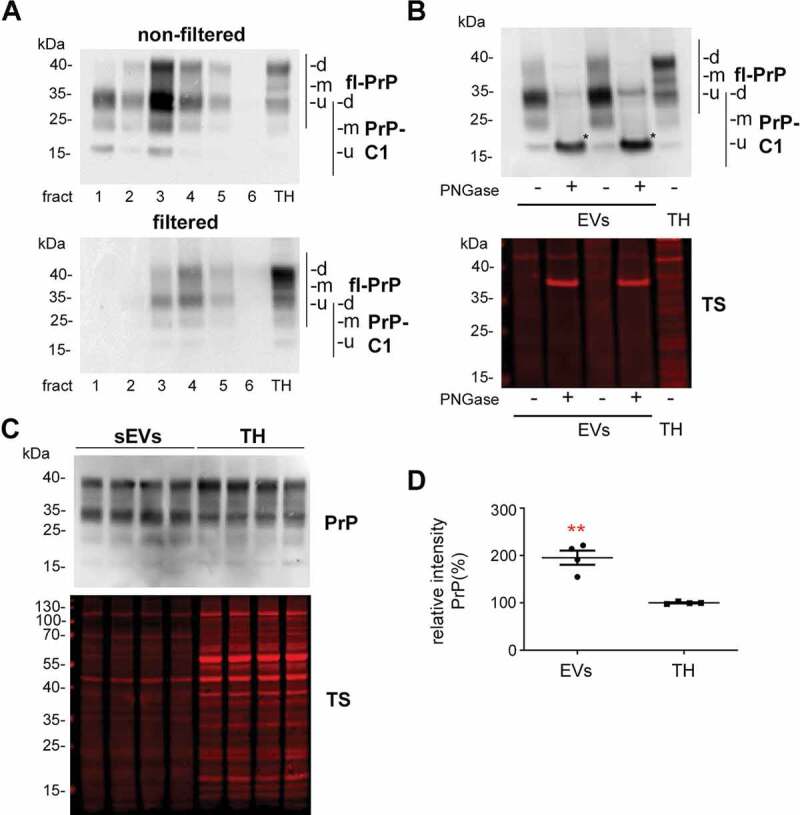
Figure 4.

Brain EVs are enriched in PrP and its C1 fragment. (A) Representative western blots of the six fractions obtained after sucrose gradient centrifugation of non-filtered (EVs) and filtered EVs (sEVs) probed with POM1 antibody. A total homogenate (TH) was loaded for comparison. Note that PrP in the TH presents with a prominent diglycosylated full-length band (fl-PrP) at 43 kDa followed by two lowerbands, corresponding to mono- and unglycosylated PrP, respectively. In EVs, a major band at 34 kDa is presented which could either correspond to unglycosylated fl-PrP or to its diglycosylated truncated C1 fragment (PrP-C1). (B) Representative Western blots of EV fractions 3 and 4 treated (+) or not (-) with PNGase F and probed with POM1 and total protein staining (TS). The PNGase digestion reveals that the major band at 34 kDa present in the EVs corresponds to the C1 fragment (marked with an asterisk). (C) Representative Western blots of pooled sEVs (n = 4) compared to their respective total brain homogenates (TH) probed with POM1 and total protein staining (TS). (D) Scatter plot showing the quantification of the comparison between total PrP in the TH versus sEVs. PrP shows a significant twofold increase in sEVs relative to the TH. Each lane was first referred to its total protein staining and then the means for total PrP in sEVs and TH were compared. The mean, SEM and p-values are stated in the main text.
