Figure 6.

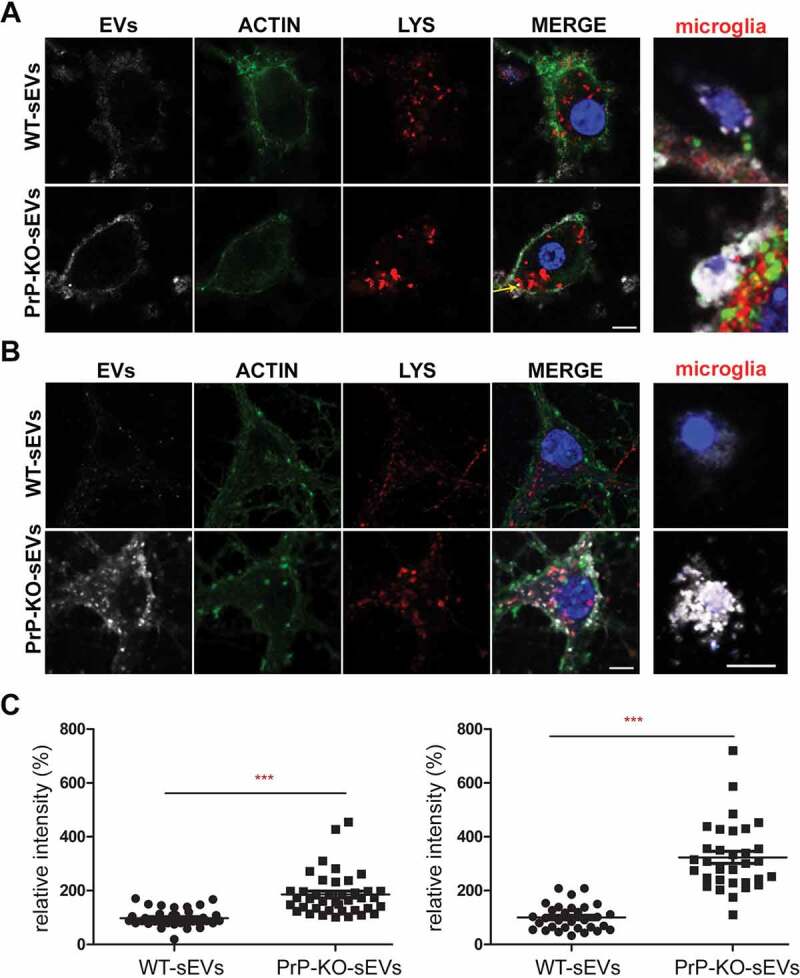
PrP influences brain sEVs uptake by primary neurons. (A) Representative confocal microscopy images of primary neurons from WT mice in high-density culture (HDC) incubated for 1 h with sEVs isolated from either WT (WT-sEVs) or Prnp0/0 mouse brains (PrP-KO-sEVs) and labelled with mCLING dye. Small EVs signals are shown in white. Neurons were stained with phalloidin (green; to visualize F-actin), the lysosomal marker LAMP-1 (red), and with DAPI (blue; to visualize the nucleus). Note that after 1 h of incubation, WT-sEVs present with a weak and rather diffuse staining at the neuronal plasma membrane, whereas PrP-KO-sEVs show a dotty staining at the neuronal plasma membrane with some PrP-KO-sEVs being present inside the neuronal cell body (yellow arrow). In this HDC condition, other cell types (apparently microglia based on their morphology in culture) were observed to take up a few WT-sEVs, yet conspicuously much higher amounts of PrP-KO-sEVs. (B) Representative confocal images of low-density culture (LDC) primary neurons from WT mice incubated for 1 h with sEVs isolated from WT (WT-sEVs) or PrP-KO mouse brains (PrP-KO-sEVs) labelled with mCLING as in (A). Here again, PrP-KO-sEVs (showing a distinct dotty pattern inside neurons) are taken up more readily than WT-sEVs. Cells presumed to be microglia cells (see also Figure 7A) showed a similarly strong engulfment pattern for sEVs from PrP-KO brain as in (A). Scale bar is 5 µm. (C) Scatter plot showing intensity of sEVs quantification in high-density (HDC, on the left) and low-density primary neuronal cultures (LDC, on the right). PrP-KO-sEVs are significantly more taken up by neurons after 1 h than WT-sEVs. The mean, SEM and p-values are given in the main text.
