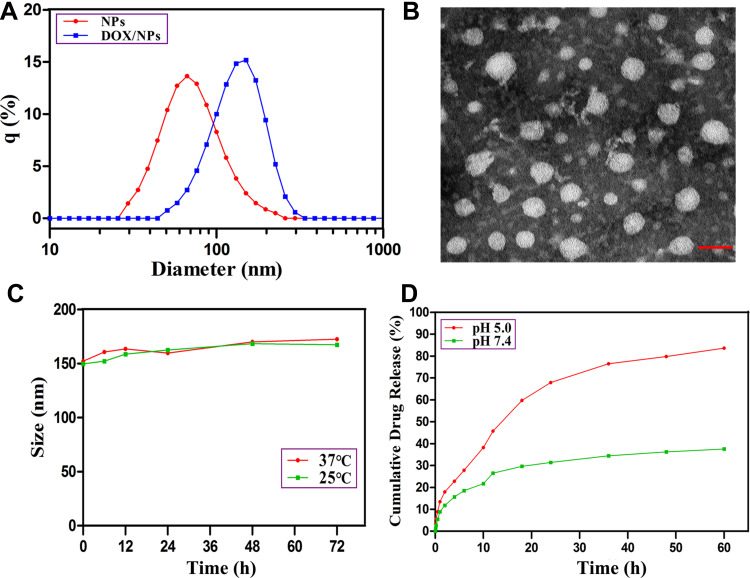
Figure 1.
Characterization of DOX/NPs. (A) The size distribution of NPs and DOX/NPs. (B) TEM images of DOX/NPs. (C) The size changes of DOX/NPs in different temperatures and times. (D) The cumulative DOX release profiles of DOX/NPs in physiological and acidic conditions at 37°C. The scale bar of the TEM is 200 nm. The data represent mean ±SD. n=3–4.

