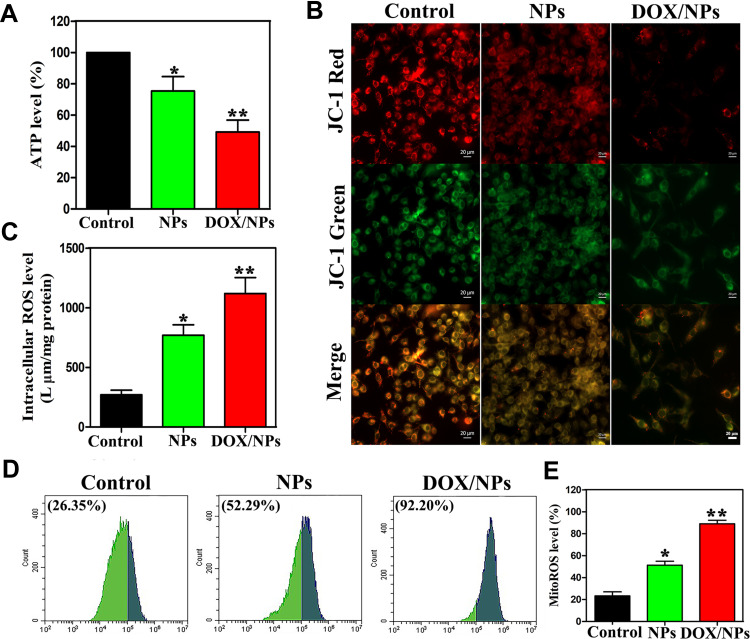
Figure 3.
Effect of NPs and DOX/NPs on mitochondrial function. (A) The relative ATP levels indicated by protein content after NPs or DOX/NPs treatment for 48 h. (B) The representative images of mitochondrial membrane potential determined by confocal microscopy. The cells with green-positive and red-negative fluorescence were counted as depolarized cells. (C) The relative fluorescent intensity of intracellular ROS level. (D) The relative fluorescent intensity and (E) flow cytometry of MitoROS levels. The data represent mean ±SD. n=3–4. *p<0.05 vs control, **p<0.01 vs NPs.

