Figure 6.

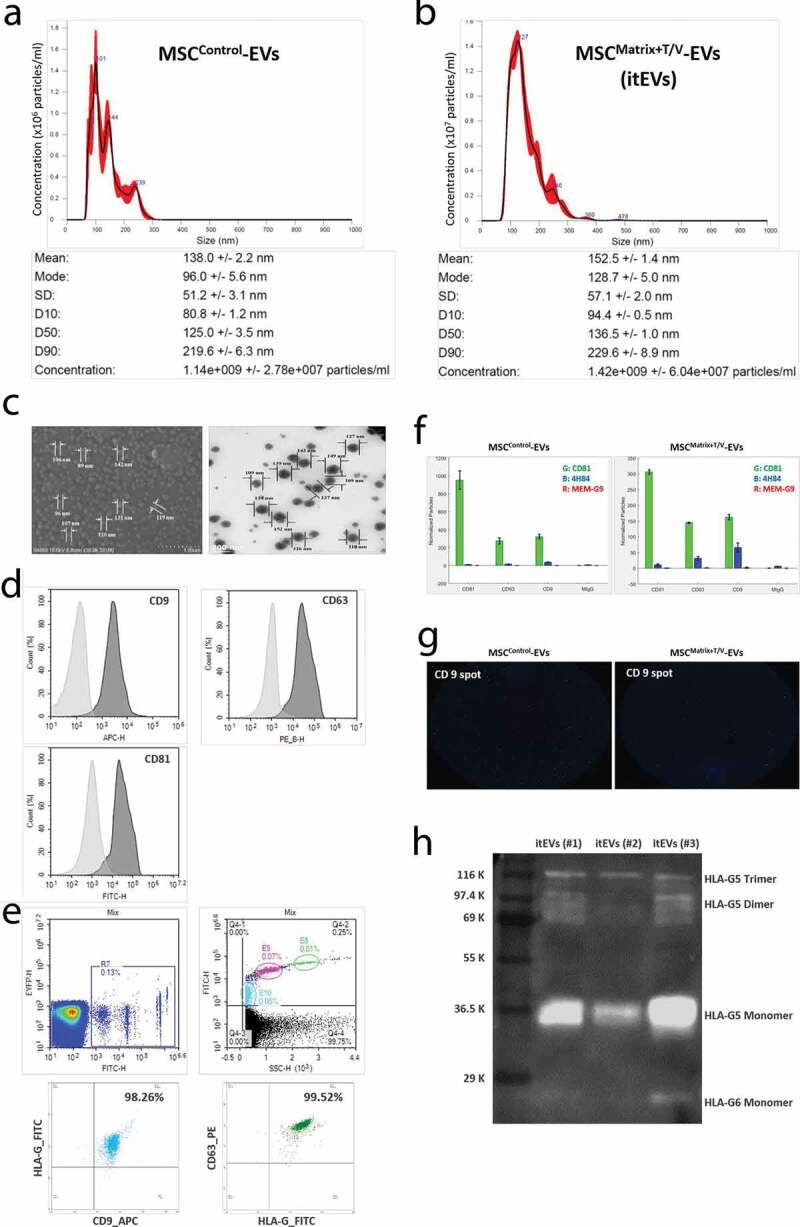
Characterization and Evaluation of itSC-EVs. (a) NTA analysis of EVs derived from MSCControl cultured on a general culture plate without temperature/vibration conditions. (b) NTA analysis of EVs derived from MSCMatrix+T/V cultured on the HA-MatrixDecidua+itEVT containing itTBC-EVs with the in vivo-like temperature change and vibration conditions. MSCMatrix+T/V-EVs (itSC-EVs) have more EV particles than MSCControl due to high proliferation rate in the ex-vivo culture system. (c) The images of MSCMatrix+T/V-EVs using SEM (left) and TEM (right), respectively. (d) FACS analysis of MSCMatrix+T/V-EVs to investigate the expression of exosomal markers (CD9, CD63 and CD81) (E) FACS analysis of MSCMatrix+T/V-EVs to investigate the co-expression of exosomal markers (CD9 and CD63) and HLA-G (MEM-G/9). The upper panel represents analysis of reference beads with different sizes. The light blue-coloured area is gating for 100 nm-size beads, the pink-coloured area is gating for 200 nm-size beads, and the green-coloured area is gating for 500 nm-size beads, respectively. The lower panel shows FACS analysis of double-stained MSCMatrix+T/V-EVs, HLA-G/CD9 (left) and HLA-G/CD63 (right). (f) The expression of HLA-G isoforms in MSCMatrix+T/V-EVs and MSCControl-EVs using ExoView. The expressions of 4H84 (with blue bar) is much higher in MSCMatrix+T/V-EVs than MSCControl-EVs. (g) The capture images of HLA-G-bound EV spots (blue and red) captured with CD9 antibody using ExoView. (h) Western blot analysis of MSCMatrix+T/V-EVs for soluble HLA-G5/G6 detection using 5A6G7 antibody. Three individually prepared MSCMatrix+T/V-EVs contains HLA-G5 monomer, dimer and trimer forms, and HLA-G6 monomer in a MSCMatrix+T/V-EVs. These findings show that MSCMatrix+T/V-EVs is the immune-tolerized EVs (itEVs) containing various HLA-G isoforms. Error bars represent SD.
