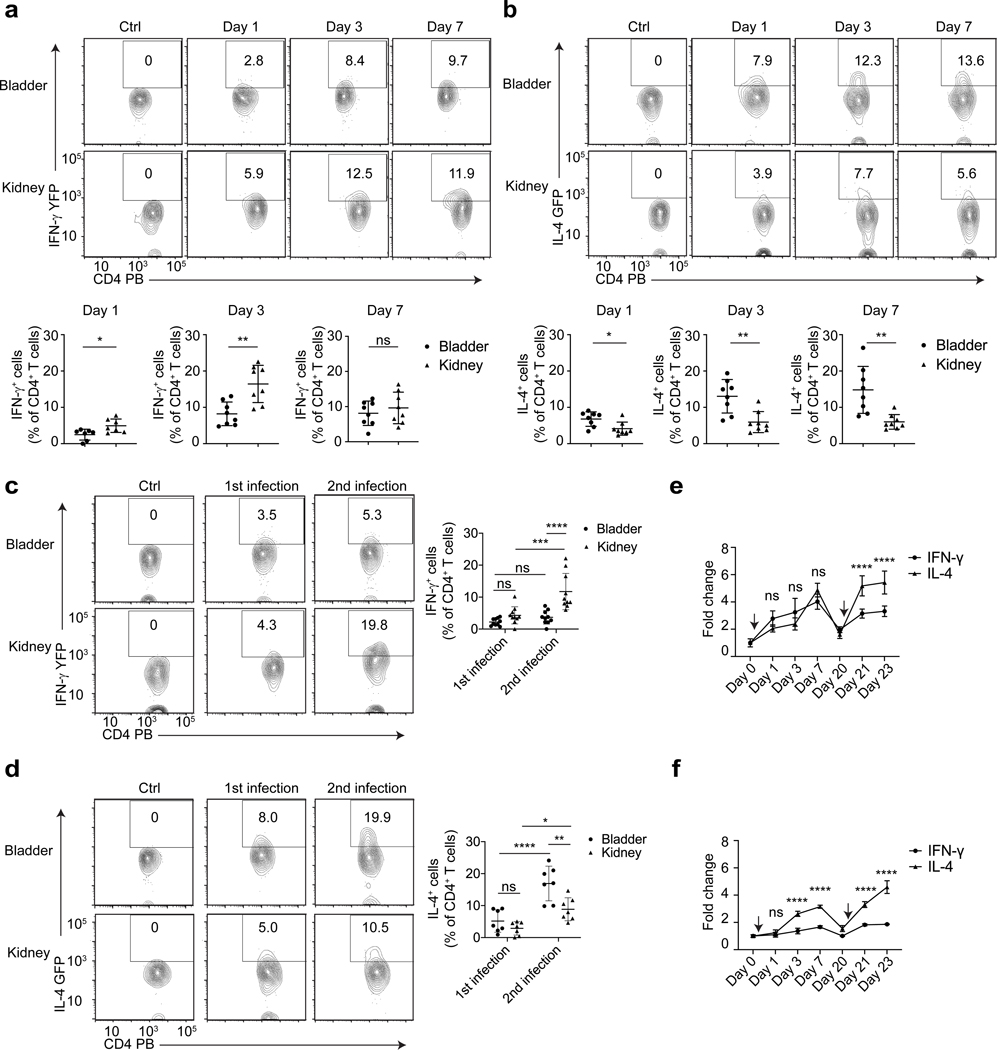
Figure 2. CD4 T cells are preferentially differentiated into TH2 cells in the bladder particularly after a second infection.
UPEC was administered into the bladders and kidneys of Great mice (a) or 4get mice (b), and on Day 1, 3, 7 post infection, bladders and kidneys were collected for flow cytometry analysis. WT C57BL/6J mice intravesically infected with UPEC for three days serve as negative control for fluorescence protein intensity level. The IL-4+ CD4 T cell percentage among total CD4 T cells are quantified below, n=8 mice per group. Three weeks after the first infection, a second infection was given to Great mice (c, n=8 mice) or 4get mice (d, n=7 mice), bladders and kidneys were collected on Day 1 after the first and second infections for flow cytometry analysis. WT C57BL/6J mice intravesically infected with UPEC for three days serve as negative control for fluorescence protein intensity level. The quantification of these results is shown (right). The first and second bladder infections were induced in the bladders of C57BL/6J (e) or BALB/cJ mice (f), then bladders were collected and lysed at the indicated time points. IFN-γ and IL-4 levels in whole bladder lysates were assessed by ELISA and normalized to levels on Day 0, n=6 mice. Black arrows indicate the time point of bacteria delivery. Data are shown as mean ± SD and were analyzed by an unpaired two-tail t test (a, b), or an ordinary two-way ANOVA with a Turkey’s multiple comparison post-test (c-f). *p<0.05, **p<0.01, ***p<0.001, ****p<0.0001, ns= not significant.

