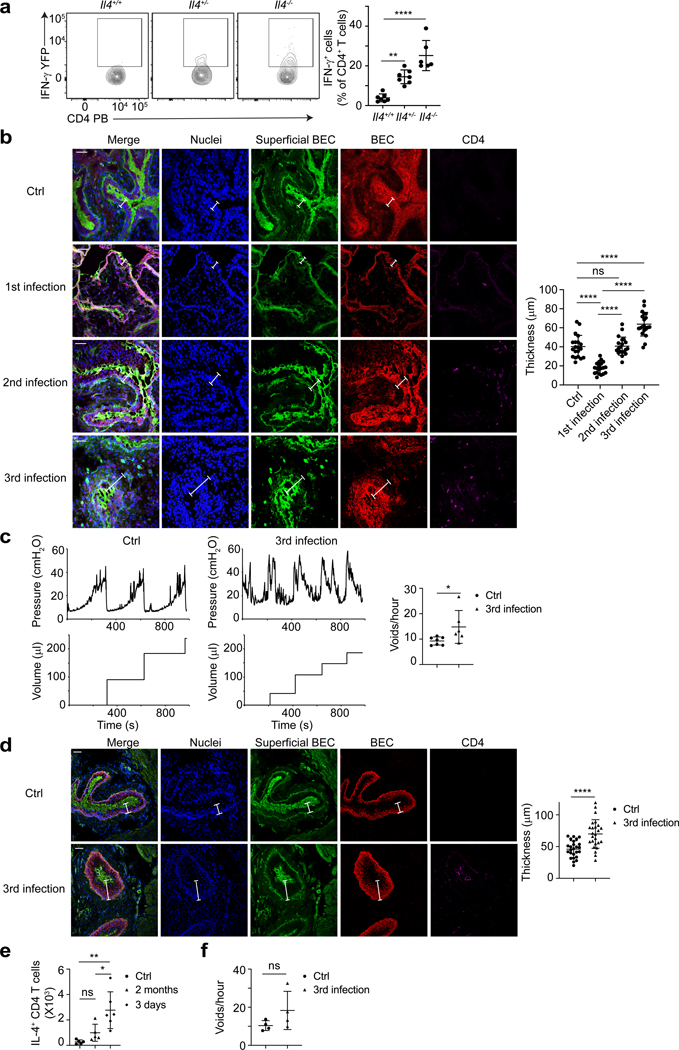
Figure 7. Repeated bladder infections promote TH2 mediated bladder epithelium repair at the expense of bacterial clearance.
a, UPEC was administered into the bladder of Great mice with Il4+/+, Il4+/− or Il4-/−. Three days later, bladders were collected for flow cytometry analysis. n=6 mice per group. b, Cross section and immunofluorescence staining were done after each infection. Blue is nuclei (DAPI), green is superficial BEC (WGA-FITC), red is total BEC (Cytokeratin 5), magenta is CD4 T cell (CD4). White label indicates the thickness of the epithelium, white bar marks 50μm. Quantification of the epithelium thickness is shown (right), n=4 mice. c, Mice bladders were given three times of UPEC or PBS, and analyzed via bladder cystometry 14 days following the final infection. Representative tracings of intraluminal pressure and void volume are shown (left). The quantitative result of mouse voiding frequency is also shown (right), n=6 mice. d, Two months later, bladders were collected for cross section and immune fluorescence staining. Blue is nuclei (DAPI), green is superficial BEC (WGA-FITC), red is total BEC (Cytokeratin 5), magenta is CD4 T cell (CD4). White label indicates the thickness of the epithelium, white bar marks 50μm. Quantification of the epithelium thickness is shown (right), n=5 mice. e, IL-4+ CD4 T cell number in bladder was determined at 3 days or 2 months after three infections or after PBS treatment. n=6 mice. f, Mice bladders were treated three times with UPEC or PBS and analyzed via bladder cystometry two months later. The quantitative result of mouse voiding frequency is shown, n=4 mice. Data are shown as mean ± SD and were analyzed by an ordinary one-way ANOVA with a Turkey’s multiple comparison post-test (a, b, e), or an unpaired two-tail t test (c, d, f). *p<0.05, **p<0.01, ***p<0.001, ****p<0.0001, ns=not significant.

