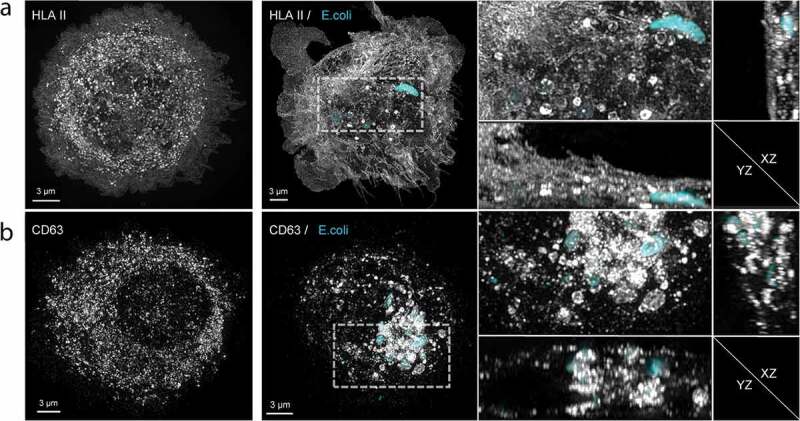
Figure 2.

Subcellular distributions of HLA II and CD63 relative to phagocytosed E. coli.
Representative flattened maximum intensity 3D SIM images from one experiment out of three independent experiments. (a) The subcellular distributions of HLA II (grey) in an immature moDC (left panel) and in an activated moDC after 16-hour incubation in the presence of Cy3B-labelled E. coli (cyan) (middle panel). Note the redistribution of HLA II from endosomal/lysosomal compartments to the plasma membrane in response to activation. The indicated segment is enlarged in the right panel, together with YZ and XZ sections of the same segment. Note the punctate HLA II staining surrounding E. coli-containing phagosomes. For 3D rotation see supplementary movie 1. (b) The subcellular distributions of the exosomal marker CD63 (grey) in an immature moDC (left panel) and in an activated moDC (middle panel) upon uptake of E. coli (cyan). The indicated segment is enlarged in the right panel, together with YZ and XZ sections of the same segment. Note the recruitment of CD63 towards the phagosome containing area of the moDC, and the punctate staining pattern surrounding the many E. coli-containing phagosomes. For 3D rotation see supplementary movie 2.
