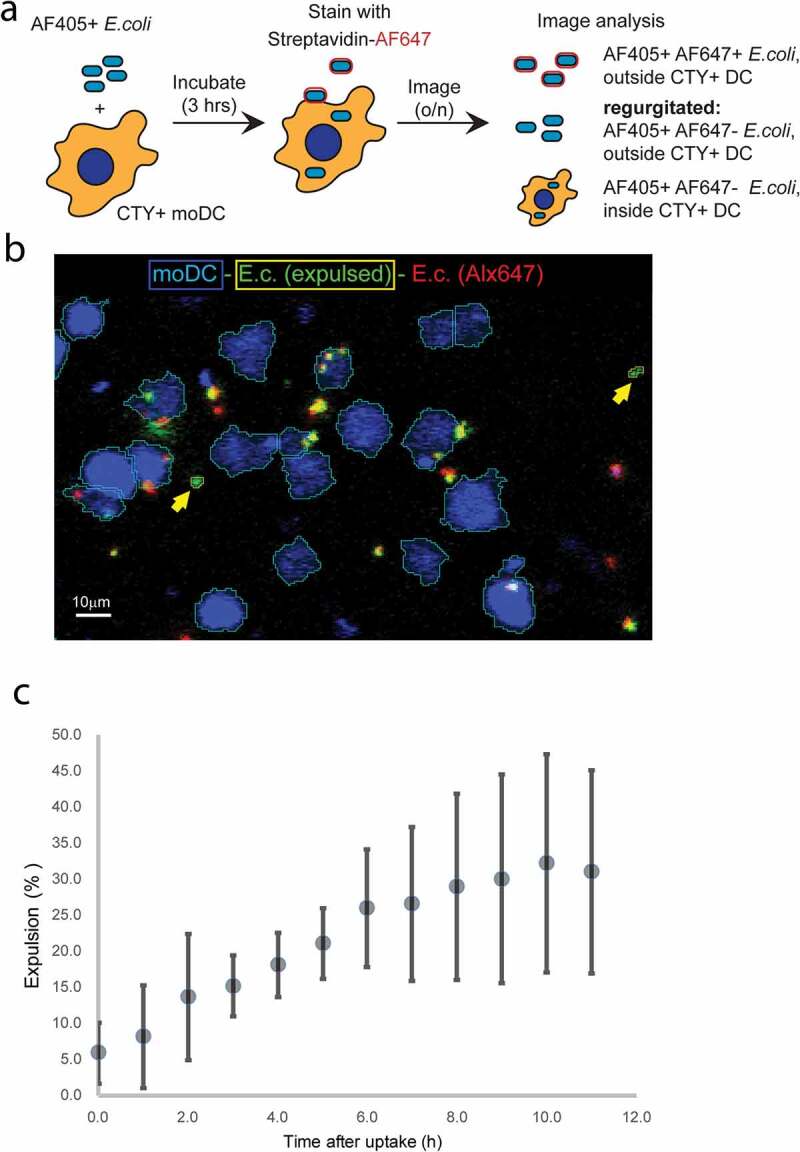
Figure 6.

Confocal microscopy-based dynamic analysis of E. coli expulsion.
(a) Schematic presentation of the experiment. CTY-labelled moDC were incubated for 3hours with E. coli that were labelled with both biotin and AF405. Subsequently, moDC were pelleted, labelled on ice with streptavidin-AF647, and washed. The cells were then transferred to a confocal microscope and followed up to 11hours in a 5% CO2 containing atmosphere at 37°C by automated live confocal fluorescence microscopy imaging at 2min intervals. CTY, AF405 and AF647 labelled objects were isolated by image segmentation and defined E. coli inside moDC (AF405+CTY+AF647−), E. coli located outside moDC after 3 hour pulse loading (AF405+CTY−AF647+), and E. coli that were expulsed during the 11 hour chase (AF405+CTY−AF647−). (b) Representative still image after 10-hour chase from one out of three independent experiments. MoDC are depicted in blue (outline cyan), cell boundaries were automatically drawn. Phagocytosed E. coli are green in a blue background, expulsed green E. coli are outside blue areas, outlined in yellow, and indicated by yellow arrows. E. coli that were not phagocytosed after pulse loading of the moDC are stained both red and green. E. coli that was not phagocytosed after pulse loading but taken up during the chase is represented by the red dots in a blue background. (c) Kinetics of E. coli expulsion. Expulsed E. coli (AF405+, CTY−, AF647−) was determined as a percentage relative to all AF405+, AF647−E. coli (within and outside CTY background). The plot represents data from three independent experiments (mean ± SEM).
