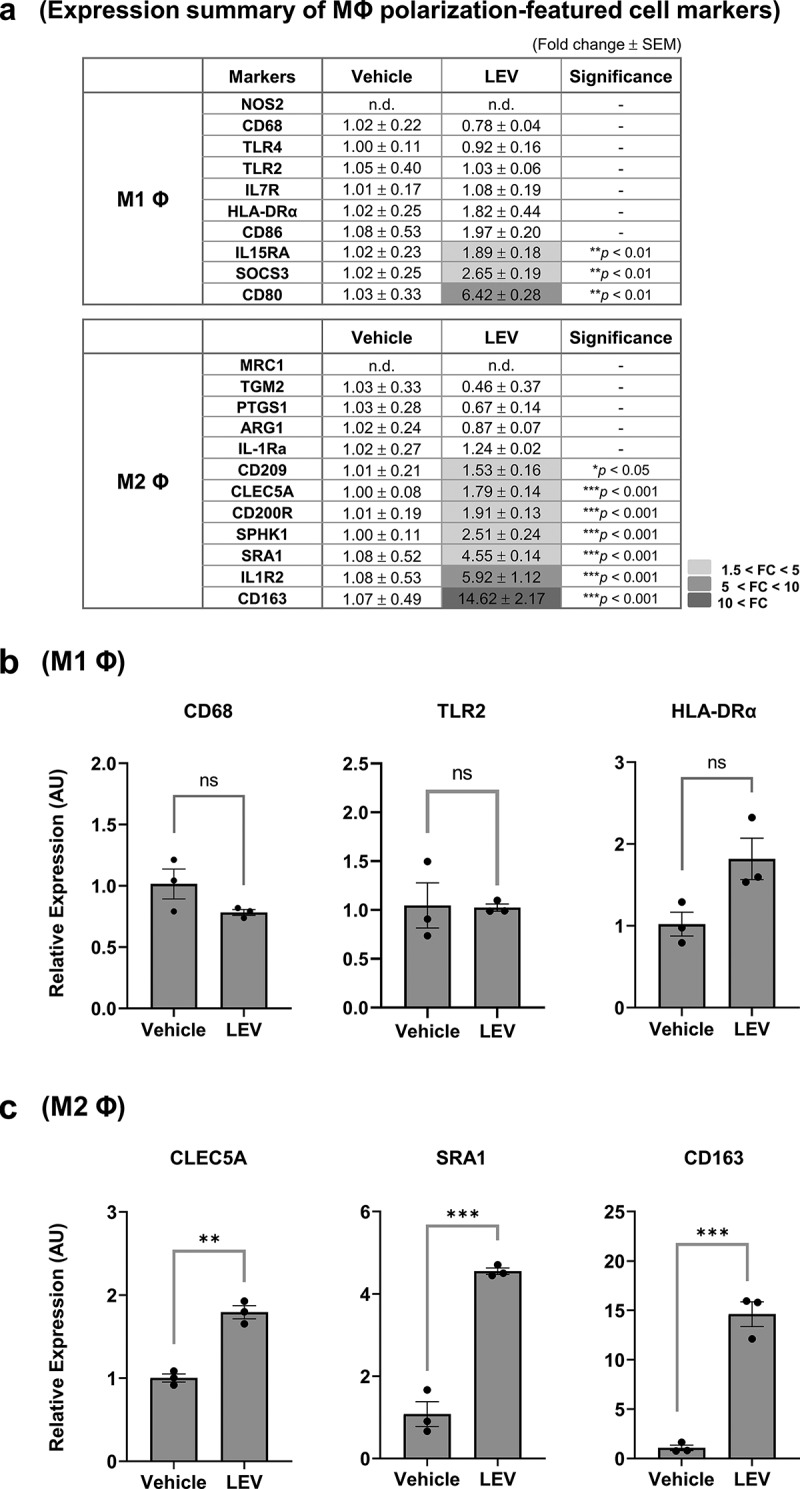
Figure 4.

LEV treatment enhances the expression of M2-polarized cell markers. THP1 cells were treated with LEVs (10 μg/mL) for 48 h. (a) mRNA expression of markers specific for M1 or M2 macrophages was analysed by RT-qPCR. G6PD was used for normalization. Statistically significant fold changes (FC) are indicated in different colours according to the increased degree (light grey, 1.5 < FC < 5; medium grey, 5 < FC < 10; dark grey, 10 < FC). -, non-significant. (b) mRNA expression of representative M1 macrophage-specific surface markers. ns, non-significant. (c) mRNA expression of M2 macrophage-specific markers. Data in (a-c) are expressed as the mean fold change ± SEM of triplicate treatments and statistical significance was analysed by Student’s t-tests.
*p < 0.05, **p < 0.01, ***p < 0.001.
