
Figure 2.
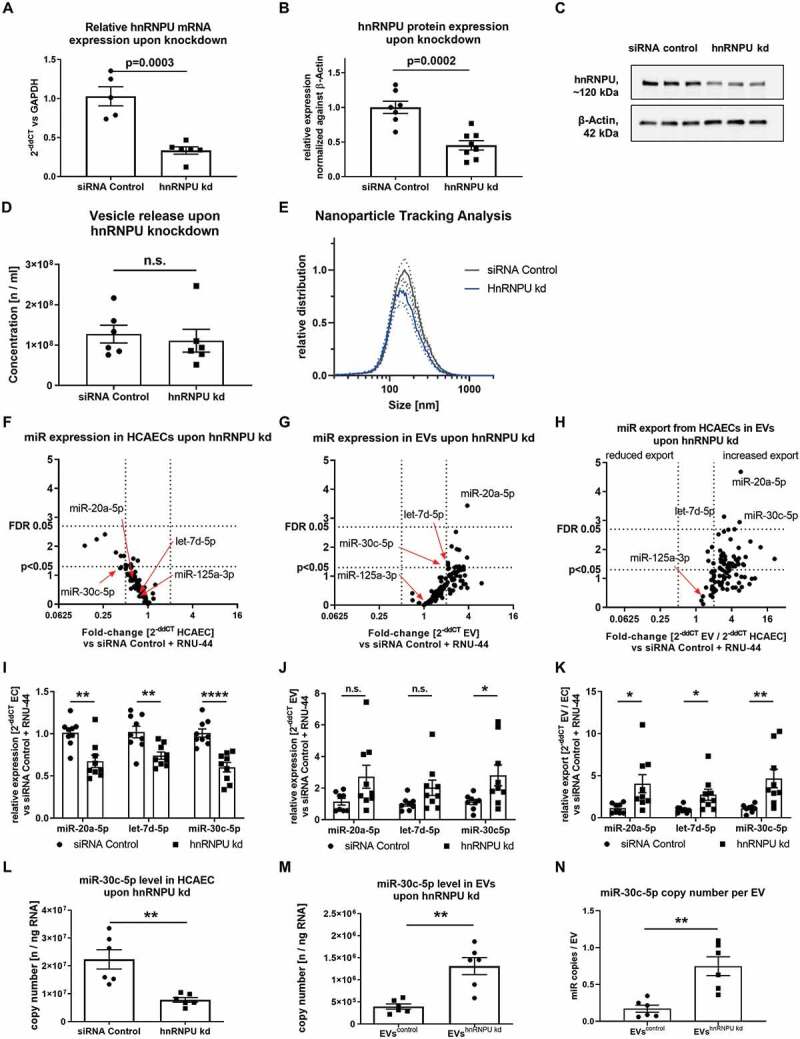
(A) Confirmation of hnRNPU knockdown (kd) in HCAECs on the mRNA level as 2−ΔΔCT relative to the siRNA control and GAPDH, n = 5/6. (B) Confirmation of hnRNPU knockdown on the protein level relative to β-Actin, n = 7/8. (C) Representative immunoblot: hnRNPU (~120 kDa), β-Actin (42 kDa). (D, E) Nanoparticle tracking analysis of EVs after hnRNPU knockdown (kd) in HCAECs vs siRNA control, n = 6; (D) total number of EVs released. (E) EV size distribution, dotted lines = SEM. (F–H) Volcano plots of Taqman microRNA array analyses of HCAECs (F), EVs (G), and relative export calculated as EVs/HCAECs (H) upon hnRNPU knockdown. Expression is calculated as 2−ΔΔCT relative to the siRNA control and RNU-44, n = 3, significance was tested with the two-stage step-up method of Benjamini, Krieger and Yektutieli, FDR level = 5%. (I–K) Validation of miR-20a-5p, let-7d-5p and miR-30c-5p expression in HCAECs and EVs upon hnRNPU knockdown as 2−ΔΔCT relative to siRNA control and RNU-44, n = 8/9. (I) HCAECs, (J) EVs, (K) relative export. All data are presented as the mean ± SEM, n.s. non-significant, unpaired t-test. (L, M) Validation of the regulation of miR-30c-5p export upon hnRNPU knockdown via quantification of absolute copy number of miR-30c-5p expression in HCAECs and EVs after hnRNPU knockdown, n = 6. N) Analysis of the miR copy number per EV particle after hnRNPU knockdown. All data are presented as the mean ± SEM, n.s. non-significant, *p < 0.05, **p < 0.01, ***p < 0.001, ****p < 0.0001 unpaired t-test, except for F-H.