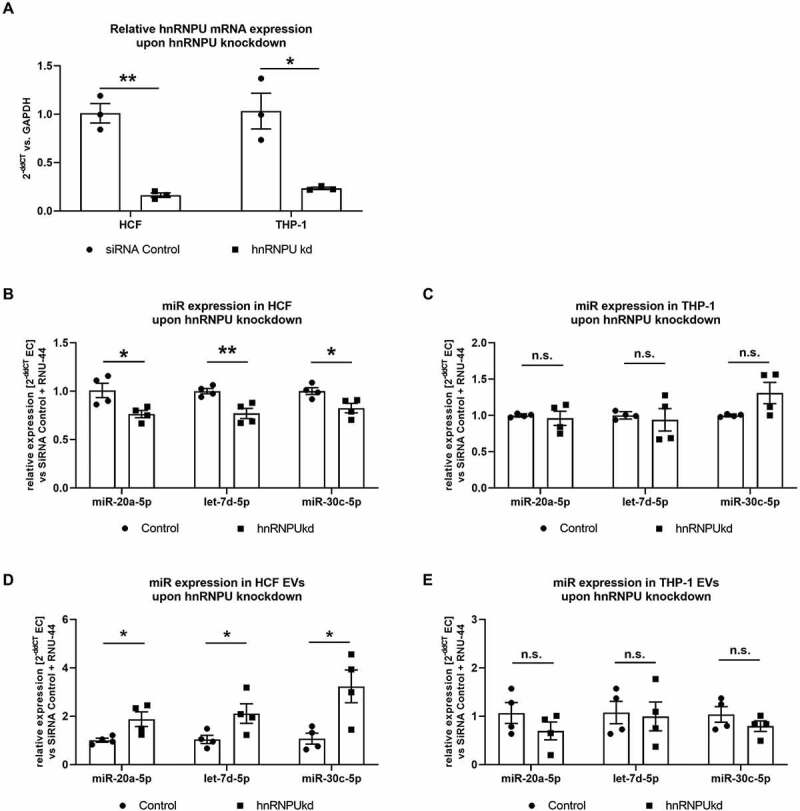
Figure 4.

(A) Confirmation of hnRNPU knockdown (kd) in HCFs and THP-1 cells on the mRNA level as 2−ΔΔCT relative to the siRNA control and GAPDH, n = 3. (B–E) Quantification of miR-30c-5p, let-7d-5p and miR-20a-5p in HCF (B) and THP-1 cells (C) and their respective EVs (D, E) upon hnRNPU knockdown as 2−ΔΔCT relative to the siRNA control and RNU-44, n = 4. All data are presented as the mean ± SEM, n.s. non-significant, *p < 0.05, **p < 0.01, unpaired t-test.
