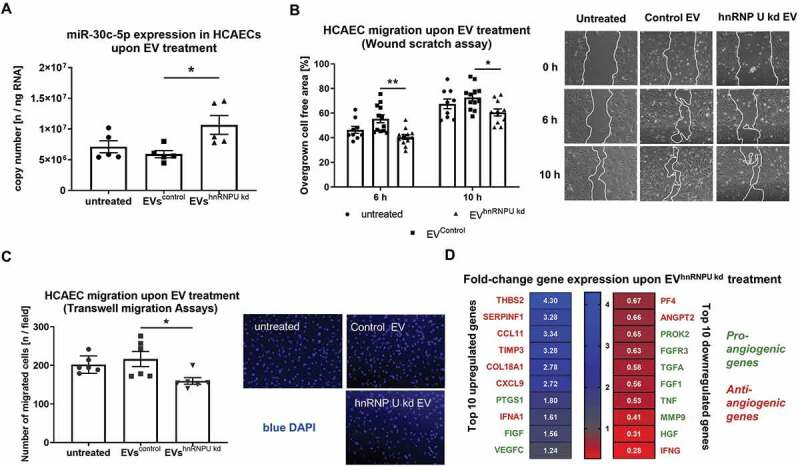
Figure 7.

(A) Absolute quantification of miR-30c-5p levels as copy number in HCAECs after incubation with EVhnRNPU kd compared to EVsiRNA Control, n = 6. (B) HCAEC migration upon treatment with EVhnRNPU kd in a scratch-wound assay with representative images, n = 9/12. (C) HCAEC migration upon treatment with EVhnRNPU kd in a transwell migration assay with representative images, n = 6. (D) qPCR-based analysis of 84 angiogenesis-related genes upon treatment with EVhnRNPU kd compared to EVsiRNA Control. Top 10 upregulated and downregulated genes are displayed as 2−ΔΔCT relative to EVsiRNA Control and GAPDH, n = 3. All data are presented as the mean ± SEM, *p < 0.05, **p < 0.01, ANOVA + Tukey post-hoc test for A, B, C, unpaired t-test for D.
