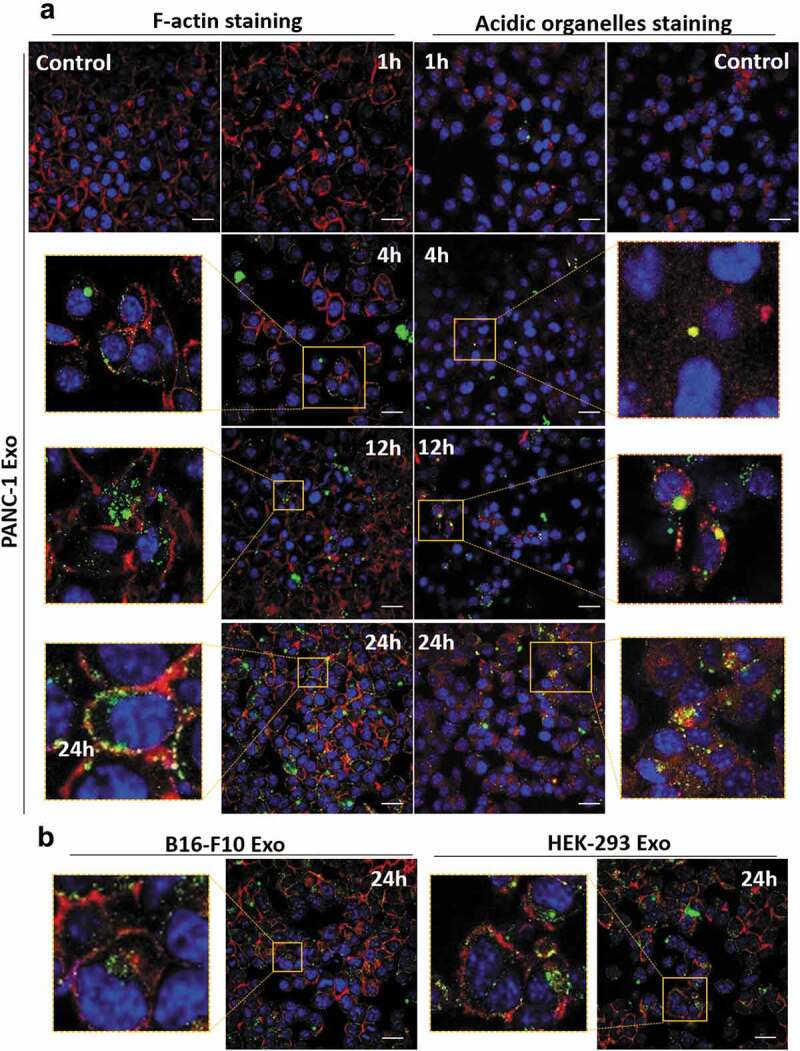
Figure 5.

Spatial distribution analysis of Exo in PANC-1 cells by confocal laser scanning microscopy (CLSM). PANC-1 cells were seeded at 30 K per well in a 24-well plate overnight. Cells were then fixed, nuclei were counter-stained with DAPI (blue), F-actin were stained with AF568 phalloidin (red). (a) PANC-1 cells incubated with AF488-labelled PANC-1 Exo (green) at 2.0 × 10¹⁰ particles per well for 1, 4, 12 and 24 h at 37°C. In a separate experiment, acidic organelles (e.g. lysosomes, late endosomes) were stained with LysoTracker Red DND-99 (577/590 nm) (red). (b) PANC-1 cells incubated with B16-F10 Exo (left) or HEK-293 Exo (right) at 2.0 × 10¹⁰ particles per well for 24 h at 37°C. Scale bar: 20 µm.
