Figure 1.

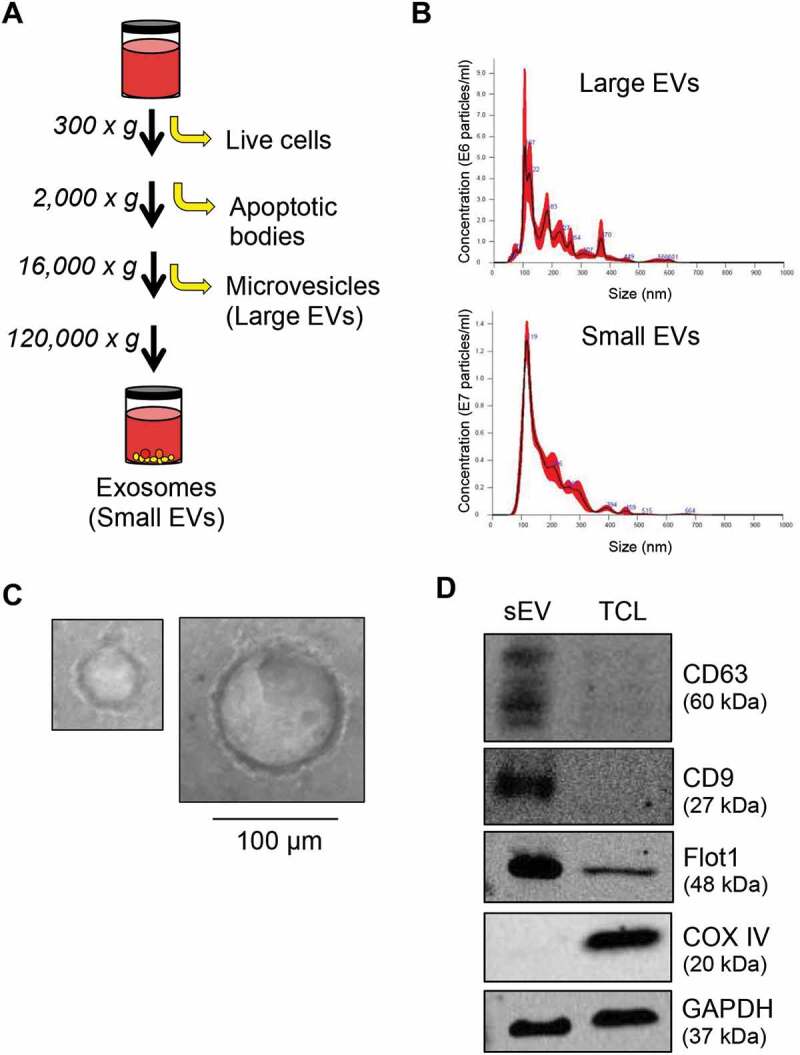
Characterisation of EVs by sequential ultracentrifugation. (A) Schematic diagram of the serial centrifugation steps used to isolate large and sEVs. (B) Dynamic light scattering measurement by nanoparticle tracking analysis (NTA) of EVs isolated from A431 SCC cells illustrating the concentration and size of particles present. (C) SEVs were loaded on a formvar carbon-coated EM mesh grid and imaged on a transmission electron microscope showing vesicles ranging in size from approximately 30 nm (left) to 100 nm (right). Scale bar, 100 µm. (D) Proteins from sEVs and total cell lysates (TLC) of A431 cells were resolved over SDS-PAGE and immunoblotted for the tetraspanin markers (CD63 and CD9), lipid raft-associated protein (Flot1), mitochondrial protein (COXIV) and GAPDH for equal loading.
