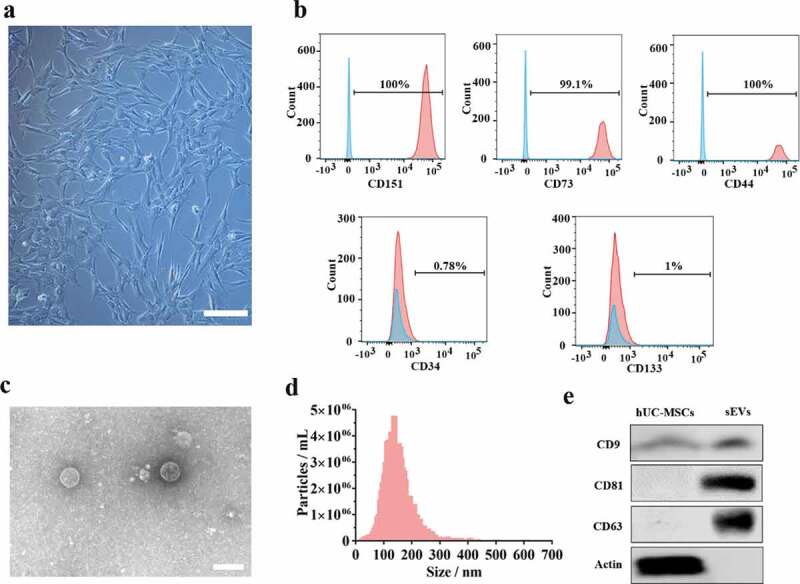
Figure 1.

Identification of hUC-MSCs and hUC-MSCs-sEVs. (a) Representative images showing the spindle-like morphology of hUC-MSCs. Scale bar: 100 um. (b) Characteristic surface markers of hUC-MSCs evaluated by flow cytometry. The blue curves represent isotype controls and the red curves represent the surface markers. (c) Morphology of hUC-MSCs-sEVs visualized under transmission electron microscopy (TEM). Scale bar: 200 nm. (d) Particle size distribution of hUC-MSCs-sEVs measured using nanoparticle tracking analysis. (e) Surface markers of hUC-MSCs-sEVs quantified by western blotting.
