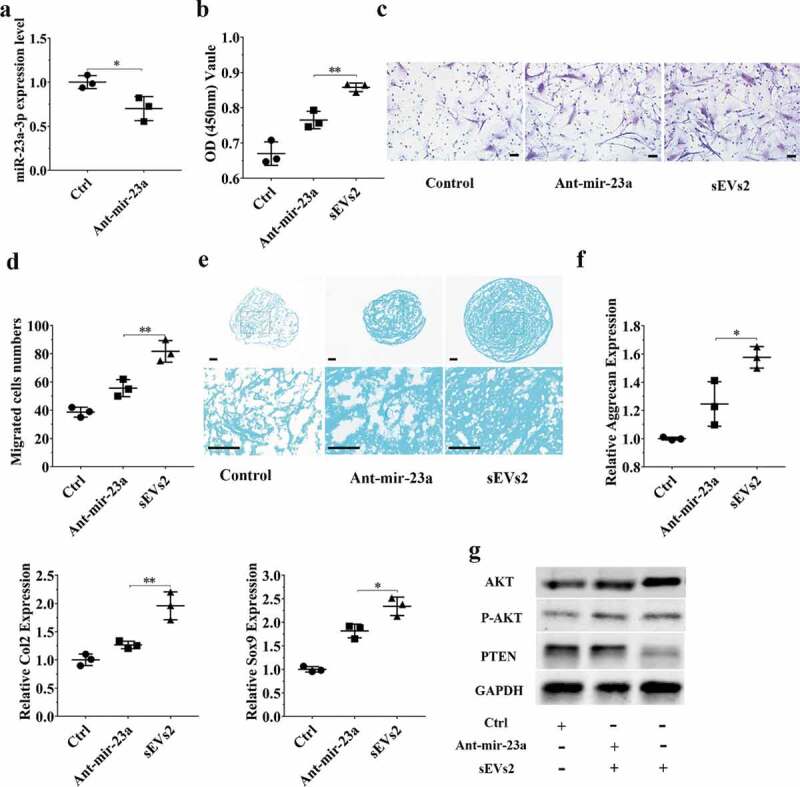
Figure 6.

miR-23a-3p silencing attenuated the effect of hUC-MSCs-sEVs in hBMSCs. (a) hBMSCs treated with antagomir-23a-3p or scramblemir (Ctrl) for 6 h, and the expression of miR-23a-3p was measured by qPCR. The results of statistical of three independent replicates are shown. ***P < 0.001. (b) Viability of hBMSCs treated with antagomir-23a-3p and hUC-MSCs-sEVs. Group ant-mir-23a represented the treatment of antagomir-23a-3p and hUC-MSCs-sEVs (10 × 108 particles/mL), Group Ctrl and sEVs2 represented scramblemir and 10 × 108 particles/mL hUC-MSCs-sEVs. Data were presented as mean ± SD of three number of replicates. **P < 0.01 (c) Representative images of transwell migration assay of hBMSCs. Scale bar: 50um. Group ant-mir-23a represented the treatment of antagomir-23a-3p and hUC-MSCs-sEVs (10 × 108 particles/mL), Group Ctrl and sEVs2 represented scramblemir and 10 × 108 particles/mL hUC-MSCs-sEVs. (d) Quantitative analysis of the migrated hBMSCs. **P < 0.01. Data were presented as mean ± SD of three number of replicates (e) Alcian blue staining of hBMSCs. Group ant-mir-23a represented the treatment of antagomir-23a-3p and hUC-MSCs-sEVs (10 × 108 particles/mL), Group Ctrl and sEVs2 represented scramblemir and 10 × 108 particles/mL hUC-MSCs-sEVs. (f) RNA expression levels of Sox9, Col2, Aggrecan were measured by qPCR. *P < 0.05. Data were presented as mean ± SD of three number of replicates. *P < 0.05. (g) The protein levels of AKT, P-AKT, PTEN in hBMSCs were analysed by western blotting.
