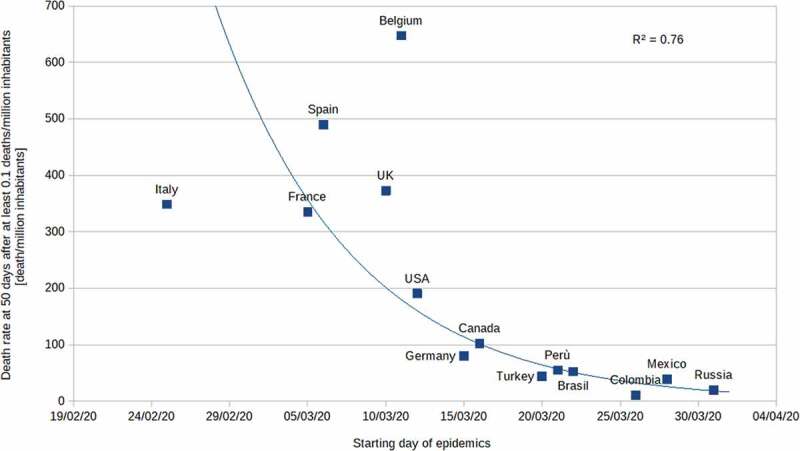
Figure 1.

Death at 50 days from fourteen countries.
Scatter plot describing death rate from fourteen countries during 50 days, starting after at least 0.1 deaths per million inhabitants. Presented as Pearson’s R2 coefficient.

Death at 50 days from fourteen countries.
Scatter plot describing death rate from fourteen countries during 50 days, starting after at least 0.1 deaths per million inhabitants. Presented as Pearson’s R2 coefficient.