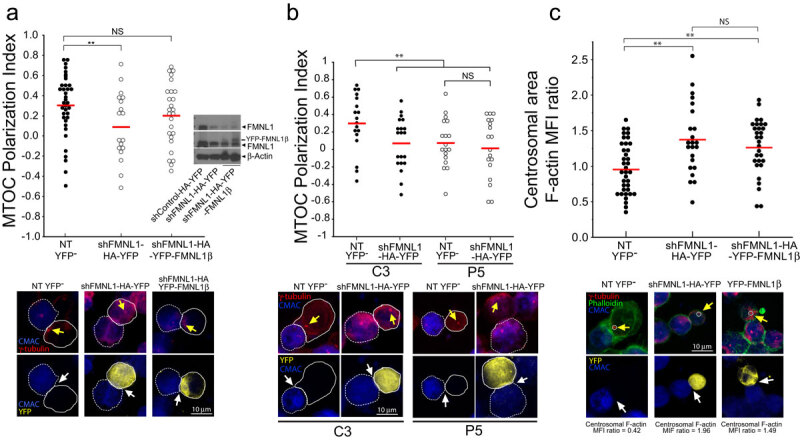
Figure 5.

FMNL1 interference affects both centrosomal area F-actin and MTOC polarization. FMNL1β regulates MTOC polarization.
C3 control and P5 PKCδ-interfered clones were transfected with either control (shControl-HA-YFP), FMNL1 interfering (shFMNL1-HA-YFP), or FMNL1-interfering, YFP-FMNL1β expressing vector (shFMNL1-HA-YFP-FMNL1). Subsequently, the transfected clones were challenged with CMAC-labelled SEE-pulsed Raji cells for 1 h, fixed, stained with anti-γ-tubulin AF546 (red) and phalloidin AF647 (green) to label F-actin, and imaged by confocal fluorescence microscopy. Yellow channel fluorescence identifies the transfected cells. Panel A, upper diagram, MTOC Pol. Index was calculated as indicated above, for the indicated number of synaptic conjugates made by C3 control clone, transfected or not (NT YFP− cells). Dot plot distribution and average Pol. Index (red horizontal line) are represented. In the inset, WB of cell lysates from the different groups of cells used was developed with anti-FMNL1 (two different expositions) and anti-β-actin to check for both FMNL1 interference and HA-YFP-FMNL1β expression. Lower panels, representative synapses made by C3 clone, transfected or not (NT YFP−). This group includes all non-transfected cells from both shFMNL1-HA-YFP and shFMNL1-HA-YFP-FMNL1β-tansfections as internal controls. AIPs of the indicated, merged channels for C3 clone forming synapses are represented. Raji cells and Jurkat clones are labelled with discontinuous and continuous white lines, respectively. Panel (b), upper diagram, MTOC Pol. Index was calculated as indicated in Figure 1, panels A and B, for the synaptic conjugates made by C3, (control) and P5 (PKCδ-interfered) clones, transfected or not (NT YFP−). Dot plot distribution and average Pol. Index (red horizontal line) are represented. Lower panels, representative synapses made by the different clones, transfected or not (NT YFP−). AIPs of the indicated, merged channels for both C3 and P5 clones forming synapses are represented. White arrows indicate the synaptic area, whereas yellow arrows indicate the MTOC position. Panel C, upper diagram, centrosomal area F-actin MFI ratio was calculated as indicated in Figure 2 for the indicated number of synaptic conjugates made by C3 control clone, transfected or not (NT YFP−). The mean centrosomal area F-actin MFI ratio (red horizontal line) for each condition is represented. Lower panels, representative synapses made by C3 clone, transfected or not (NT YFP−). AIPs of the indicated, merged channels for C3 clone forming synapses are represented. The centrosomal area F-actin MFI ratio value is indicated for each condition. The MTOC is labelled with yellow arrow and the synapses with white arrows. The white circle enclosing the MTOC labels the ROI used to calculate the centrosomal F-actin MFI. NS, not significant. **, p ≤ 0.05.
