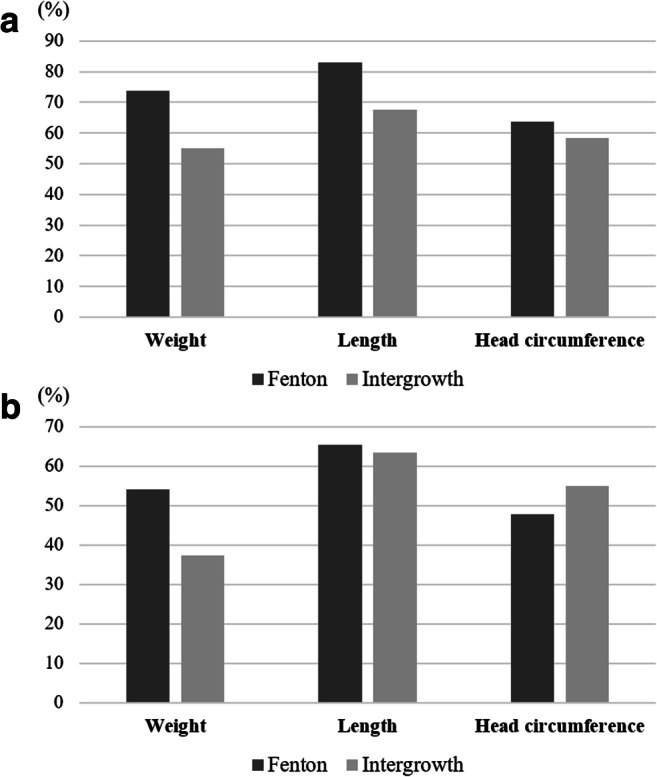
Fig. 2.

Prevalence of EUGR according to the growth charts. EUGR of weight, length and HC by the Fenton and Intergrowth charts when EUGR was defined as a decrease in z score > 1 at discharge (a) and when EUGR was defined as body size < 10th percentile at discharge (b). Cochran’s Q test showed that the p value of all comparison of EUGR between the Fenton and Intergrowth chart were < 0.001. EUGR, extrauterine growth restriction
