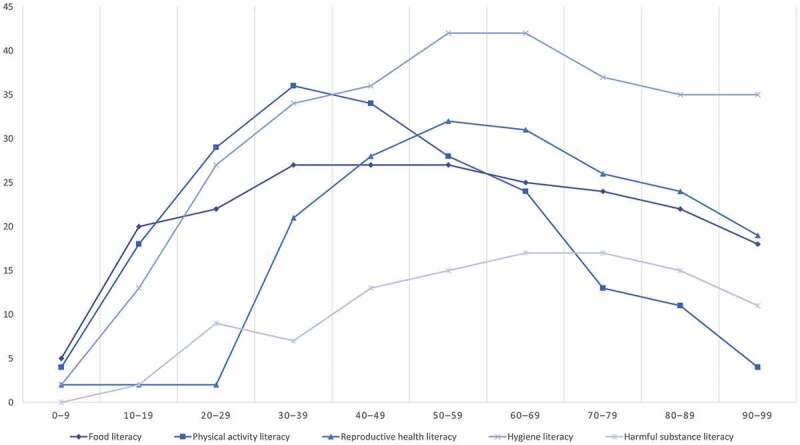
Figure 2.

Hypothetical development of health literacy over the life-course stratified by health literacy domain. The x-axis indicates age intervals of decades. The y-axis indicates level of health literacy at an arbitrary scale of measurement (0–100%).
