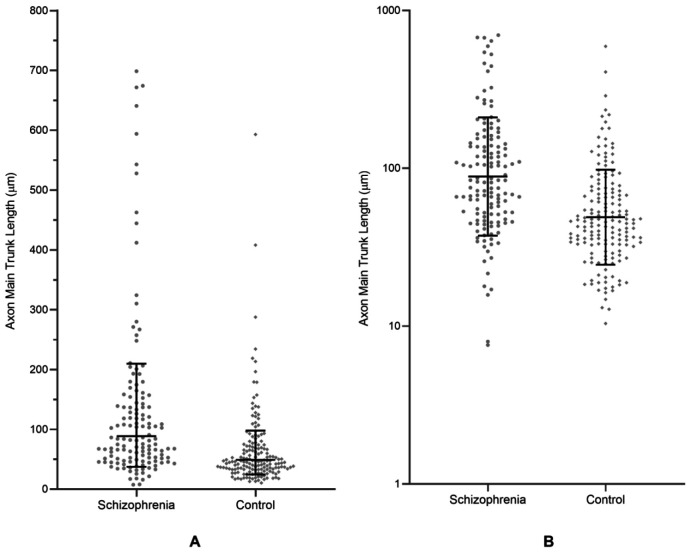
Figure 3.
Pooled data showing the comparison of axon main trunk length between the schizophrenia and control group. The black lines and error bars denote the geometric means and geometric standard deviation factors. (A) Individual data points plotted on a linear axis. (B) Individual data points plotted on a logarithmic axis.

