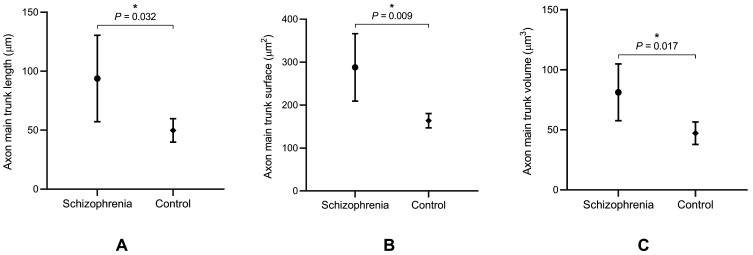
Figure 5.
Comparison of (A) axon main trunk length, (B) axon main trunk surface, and (C) axon main trunk volume between the schizophrenia and control group. The black circles and rhombs denote the arithmetic means of the schizophrenia and control group, respectively (derived from the geometric means of individual brains within each group). The error bars denote the standard deviation. Significant differences are marked by asterisks.

