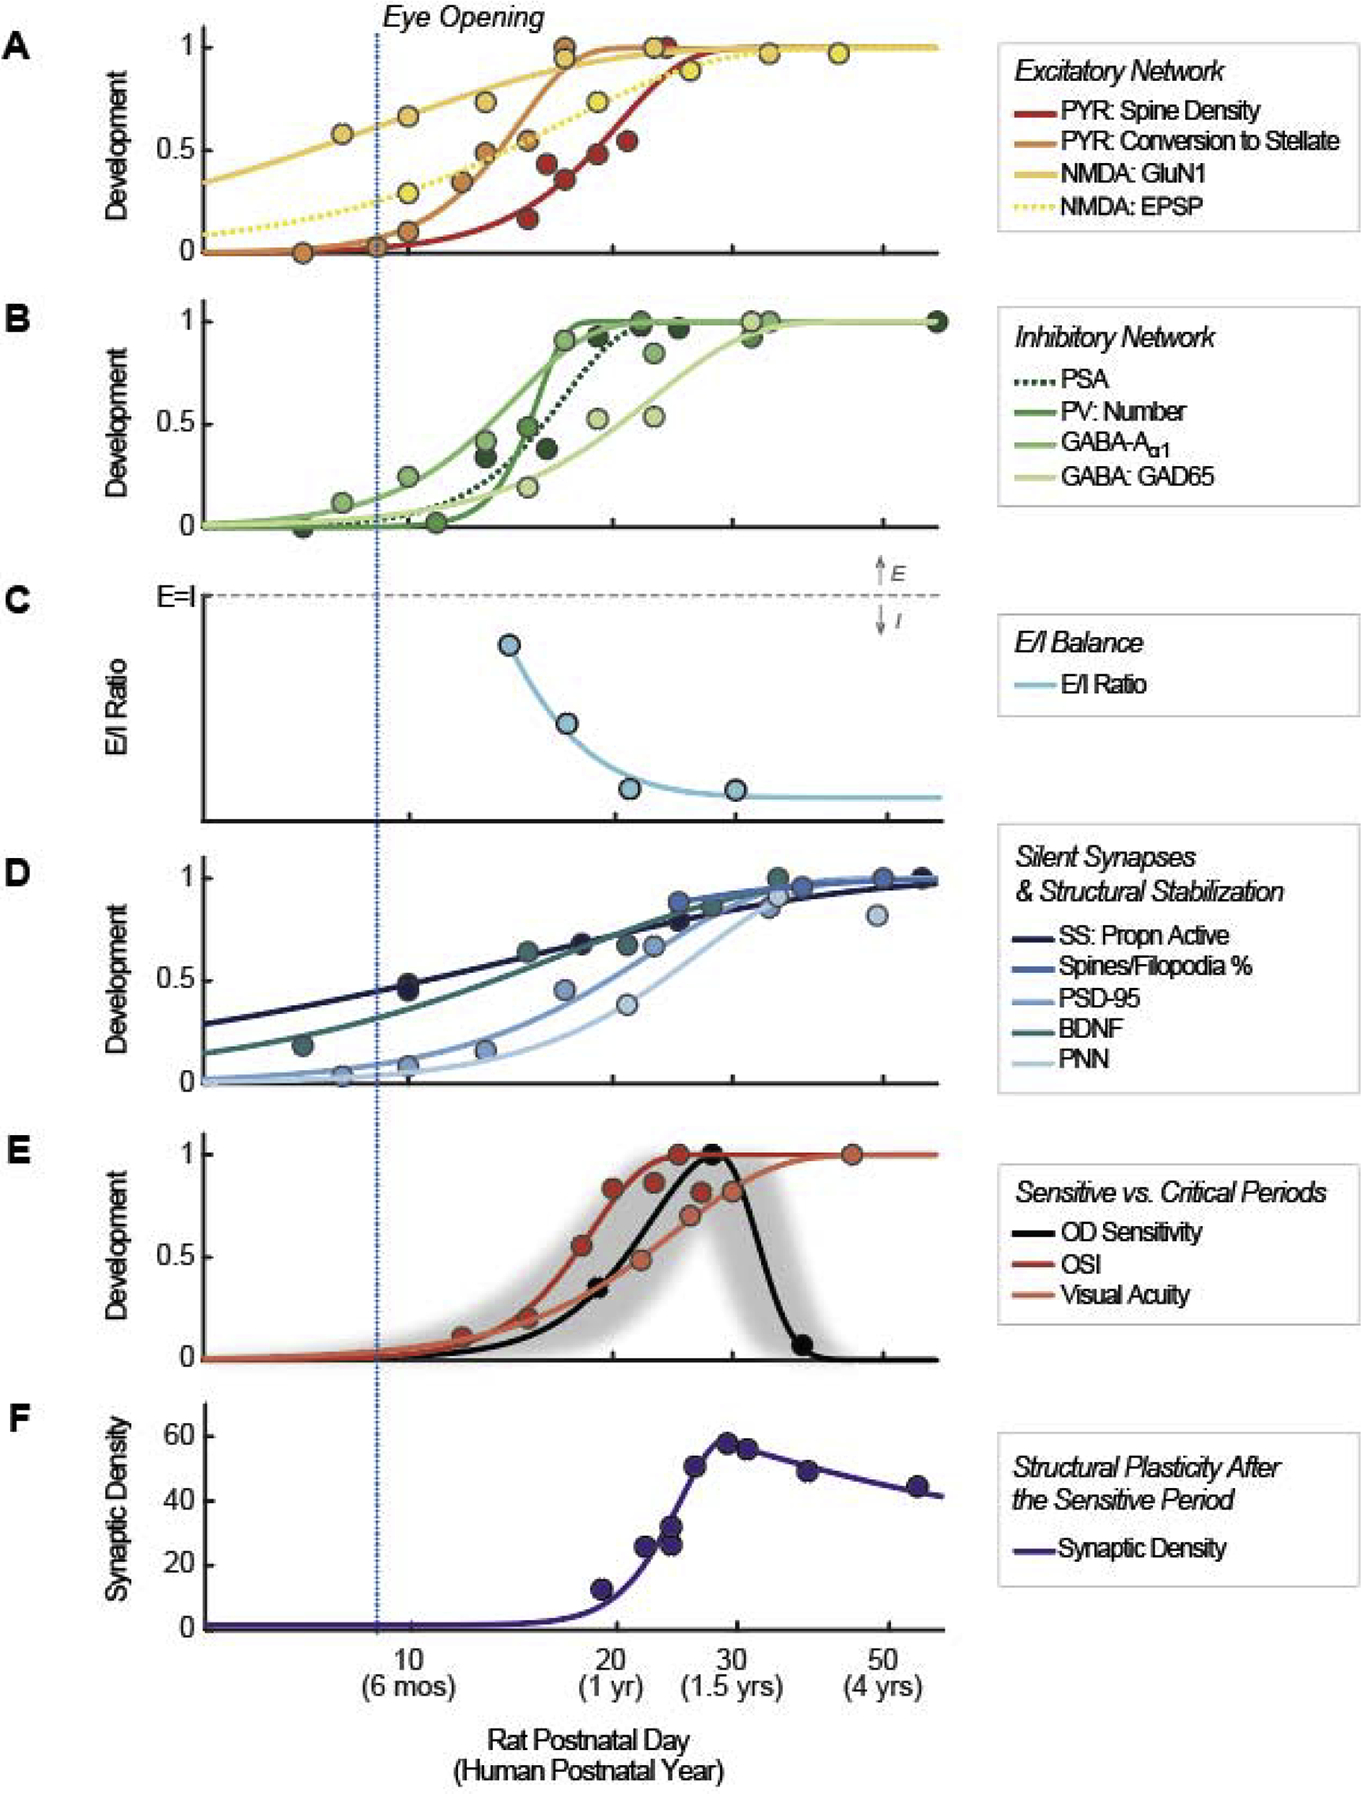
Figure 2.

A summary of sensitive period events in typically developing primary visual cortex. Data were normalized in Panels A, B, D, and E. Solid lines in these panels represent values that increase in development, which were normalized to a maximum of 1, . Dotted lines in Panels A and B represent values that decline in development, which were linearly flipped and normalized, , such that min(yorig) → y = 1, and . Data in Panels C and F were not normalized. See Table 1 for detailed data and abbreviations.
