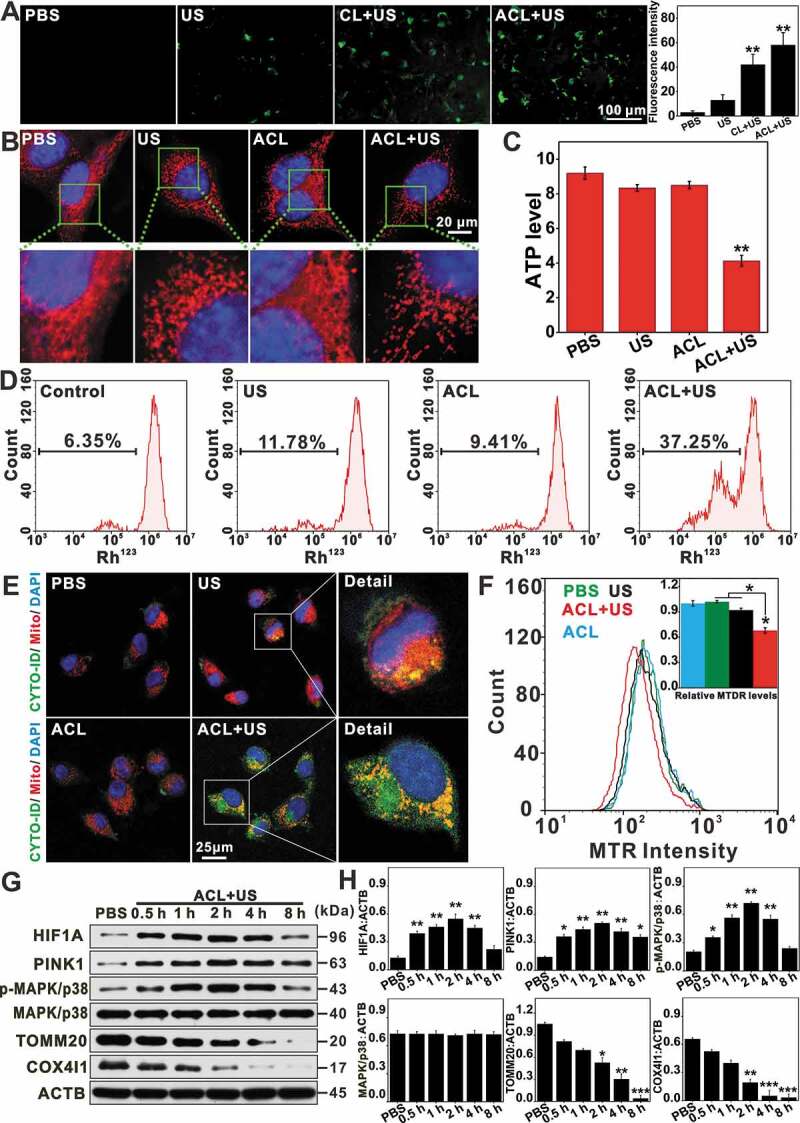
Figure 4.

ACL-SDT initiated mitochondrial dysfunction and induced mitophagy in GL261 cells. (A) Fluorescence microscope was used to detect intracellular ROS with DCFH-DA at 0.5 h post treatment. The right channel indicates the average fluorescence intensity calculated from at least 10 fields of view per group, as represented in the left channel. (Green: stained with DCF, scale bar: 100 µm). (B) Images of MTR stained mitochondria were captured upon exposure to ACL-SDT, scale bar: 20 μm. (C) ATP level was measured in cells at 4 h post different treatments. (D) Mitochondrial membrane potential was evaluated at 1 h post treatment by employing Rh123 through flow cytometry. (E) After incubation with ACL for 12 h, the cells were sonicated, and co-localization of mitochondria and autophagic vacuoles was visualized by confocal microscopy. Mitochondria (red), autophagic vacuoles (green), nuclear DAPI (blue), scale bar: 25 µm. (F) MTR fluorescence values were measured by flow cytometry to reflect the mitochondrial staining changes. (G) Western blots show the indicated protein changes at different time points following ACL-SDT treatment (Ce6 = 2 µg/mL, US = 0.6 W/cm2). (H) Quantitative analysis for the indicated protein changes as compared with ACTB. Data are presented as mean ± SD of three independent assessments. *p < 0.05, **p < 0.01, ***p < 0.001.
