Figure 8.

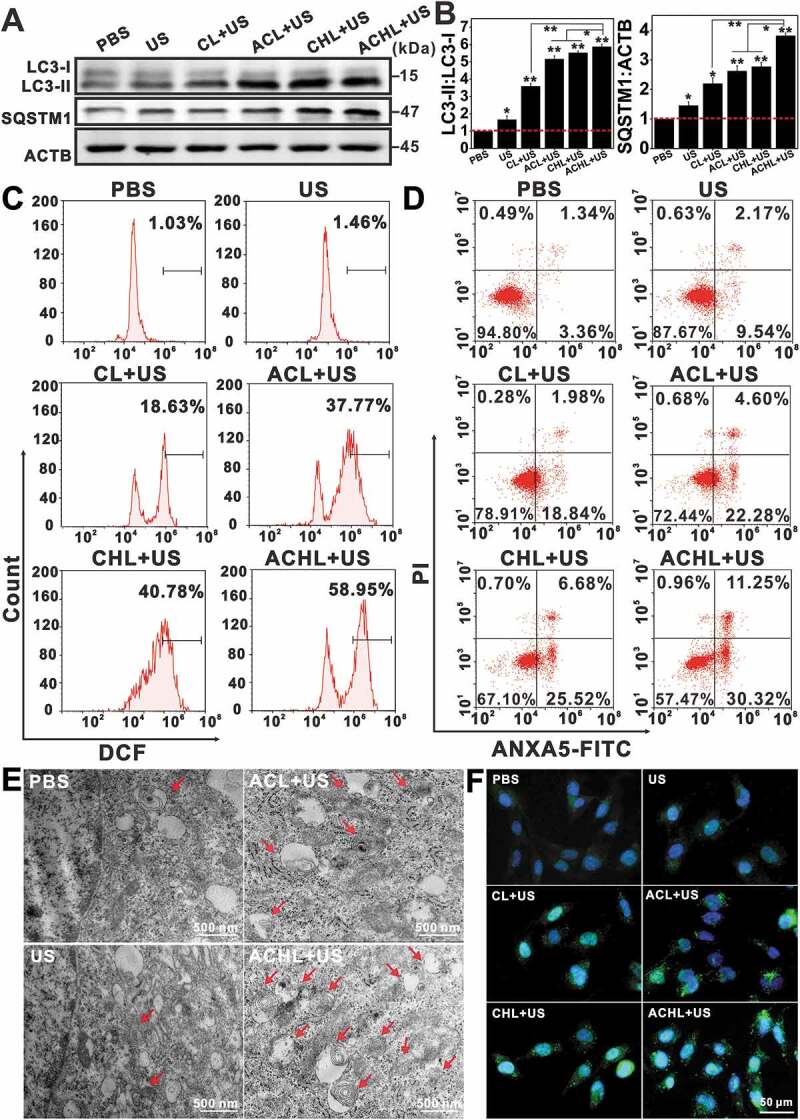
Evaluation of mitophagic vacuolization and the enhanced effects of ACHL-SDT. GL261 cells were seeded in cell culture dishes and cultured for 12 h. After incubation with the different liposome preparations for another 12 h, the cells were sonicated and cultured for 2 h, then subjected to different analysis. (A) Western blotting for LC3 and SQSTM1. (B) Quantification of the ratios of LC3-II:LC3-I and SQSTM1:ACTB in western blotting test, data are presented as mean ± SD of three independent assessments. (C) Detection of intracellular ROS with DCFH-DA at 0.5 h post different treatments in GL261 cells. (D) Apoptosis assessment at 2 h post different treatments using ANXA5-FITC-PI double-staining. (E) Representative electron micrographs of GL261 cells at 2 h post different treatments (Arrows: mitophagic vesicles, scale bar: 500 nm). (F) Changes of LC3 in GL261 cells visualized at 2 h by fluorescence microscope after different treatments, scale bar: 50 µm (LC3 were stained green with Anti-Rabbit IgG, nuclei were stained blue with DAPI). (Ce6 = 2 µg/mL, HCQ = 5 µg/mL, US = 0.6 W/cm2) *p < 0.05, **p < 0.01.
