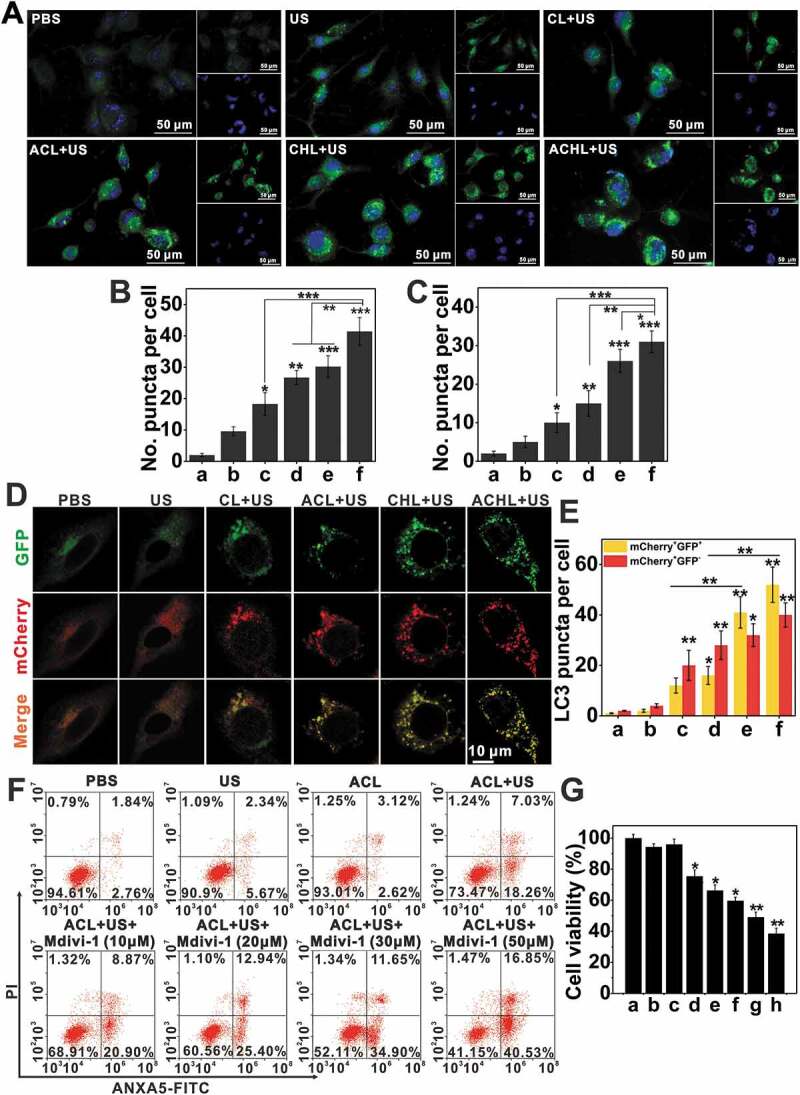
Figure 9.

The synergy of ACL-SDT and autophagy inhibition. (A) Fluorescence microscope images of mitophagic vesicles visualized by Cyto-ID green staining at 2 h post different treatments. (Mitophagic vesicles were stained green with Cyto-ID, nuclei were stained blue with DAPI, scale bar: 50 µm). (B) Quantification of Cyto-ID green puncta in (A). (C) Quantification of LC3 green puncta as shown in Figure 8F. At least 25 cells per experiment were analyzed. Quantitative analysis was from three independent experiments. (a: PBS; b: US; c: CL+US; d: ACL+US; e: CHL+US; f: ACHL+US). (D) Representative epifluorescence images of GL261-mcherry-GFP-LC3 stable cells visualized by confocal microscopy at 2 h post different treatment. (E) The number of LC3-positive dots with mCherry+/GFP+ (yellow) and mcherry+/GFP− (red) was scored. At least 25 cells per experiment were analyzed. Quantitative analysis was from three independent experiments. (a: PBS; b: US; c: CL+US; d: ACL+US; e: CHL+US; f: ACHL+US) (F and G) GL261 cells were pretreated with Mdivi-1 and then subjected to ACL-SDT. After 2 h, cell apoptosis was assessed by flow cytometry (F), and cell viability was evaluated by MTT assay (G). Data are presented as mean ± SD of three independent assessments. (a: PBS; b: US; c: ACL; d:ACL+US; e: ACL+US+Mdivi-1 (10 μM); f: ACL+US+Mdivi-1 (20 μM); g: ACL+US+Mdivi-1 (30 μM); h: ACL+US+Mdivi-1 (50 μM); Ce6 = 2 µg/mL, HCQ = 5 µg/mL, US = 0.6 W/cm2) *p < 0.05, **p < 0.01, ***p < 0.001.
