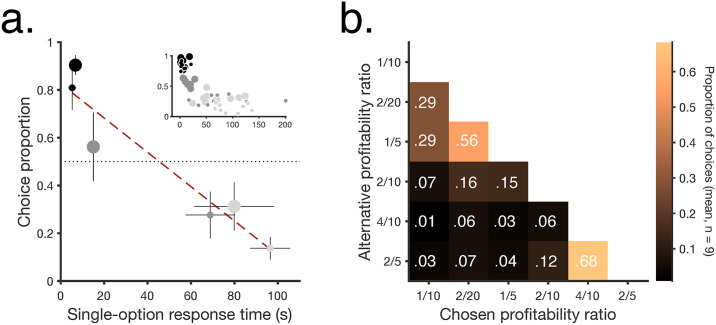
Fig 2. Profitability impacts response times and choices.
a. Preference in choice trials (mean proportion picked when presented paired with any of the other 5 profitability ratios) versus response time in single-option trials (means ± SEM, n = 9 birds). Inset shows individual data. Symbols match panel in Fig 1b. The dashed line shows a Deming regression (Estimated model: y = −0.0072x + 0.8259, [slope = 95% CI −0.004 to −0.0104]). b. Mean proportion of choices in every binary-choice combination (n = 9 birds). All data included in this figure can be found in the S1 Data file.

