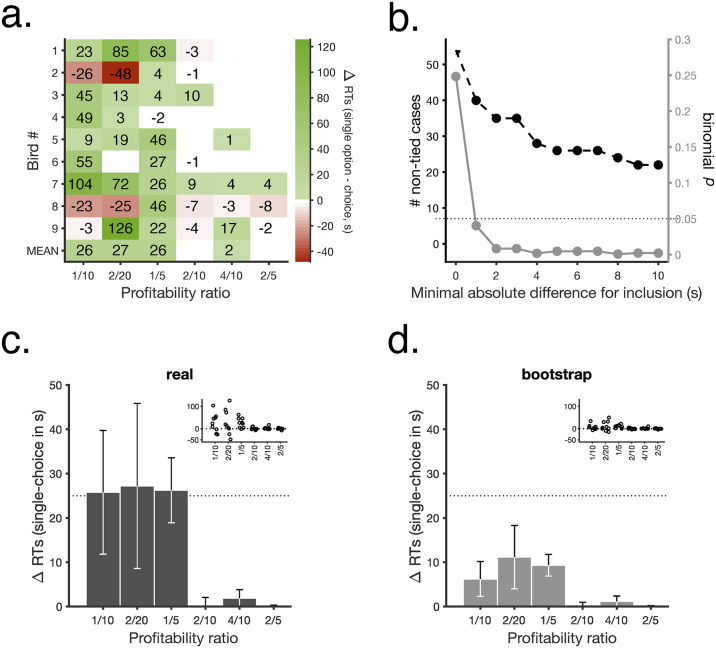
Fig 3. RTs are shorter in choices.
a. ΔRT toward each profitability ratio between single-option and choice trials, averaged against the other 5 combinations; bottom row shows means across subjects. White cells are tied cases in which differences were lower than 1s in either direction. b. Number of nontied cases (out of 54) as a function of increasing minimal absolute response time difference (black) and corresponding binomial p-value (gray). c. Mean differences of individual mean response times in single-option trials minus individual mean response times in choice trials (n = 9, mean ± SEM). Inset shows individual animal means, with symbols laterally displaced for visualization purposes. (same data as bottom row in a.) d. Same as in c. for bootstrapped differences. A repeated-measures ANOVA, with option (6 levels) and difference as factors (2 levels), and mean ΔRTs as dependent variable, showed a significant effect of difference, only (Greenhouse–Geisser adjusted F(1,8) = 7.307, p = 0.027, η2p = 0.660). All data included in this figure can be found in the S1 Data file. RT, response time; ΔRT, difference in response time.

