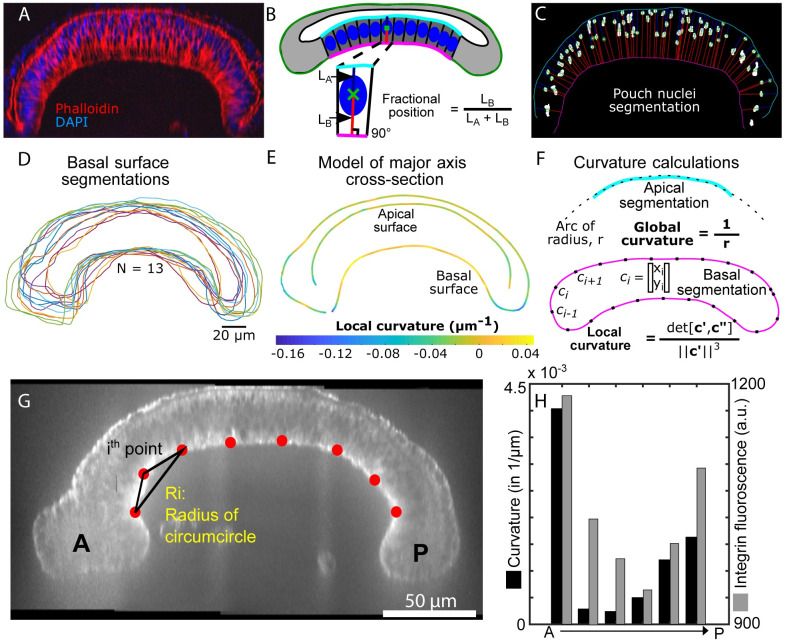
Fig 2. Quantitative analysis of wing disc shapes and nuclear positions along the major axis of imaginal wing discs at 96 hours AEL.
(A) Representative pre-processed image of a wing disc cross-section stained with DAPI (nuclei) and phalloidin (staining F-actin). These images were used segment nuclei and surfaces defining the wing disc shape. B) The fractional position between the apical and basal surface serves as a metric for quantifying relative nuclear positions. Note: heights of columnar pouch cells were calculated as the sum of LA and LB. C) Representative segmentation of nuclei. Blue and red lines correspond to LA and LB in B, respectively. D) Basal surface segmentation for multiple samples in different colors (N = 13). E) Composite representation of wing disc morphology generated from samples in D. F) Quantification of global and local curvatures. Fig A and Fig B in S4 Text provide additional details on the image processing pipeline. G) Representative image highlighting average curvature quantification used for H, the curvature was found using a circumcircle approach. H) Curvature quantification of regions of interest along the pouch as well as intensity quantification of integrin along the basal side of the pouch.

