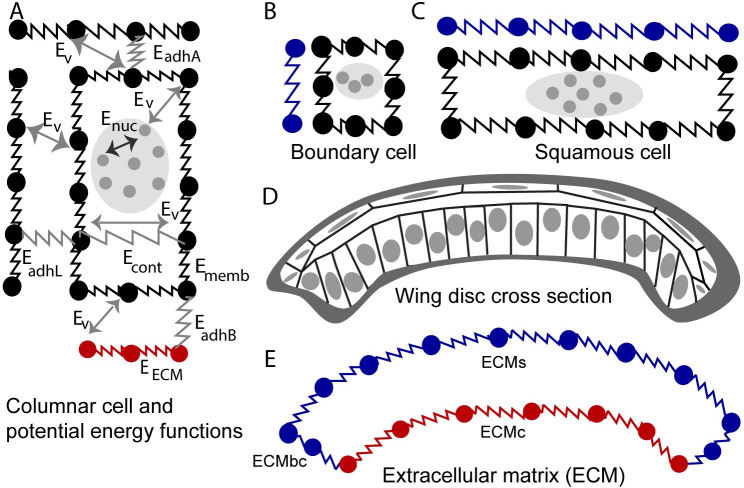
Fig 10. Diagram of the subcellular element (SCE) model of the cross-sectional profile of the wing along the major anterior-posterior axis.
(A) Columnar cell submodel with its potential energy functions describing interactions between adjacent cells, intracellular interactions, and cell-ECM interactions. (B) Marginal boundary cell submodel. (C) Squamous cell submodel. (D) Diagram of the cross-sectional profile of the wing along the anterior-posterior axis which includes columnar cells, boundary cells, squamous cells, and ECM. (E) Diagram of the submodel of the ECM divided into separate sections: ECMc, ECM associated with columnar cells in the wing pouch; ECMbc, ECM associated with the marginal boundary cells at the lateral region of the disc, and ECMs, ECM associated with squamous cells.

