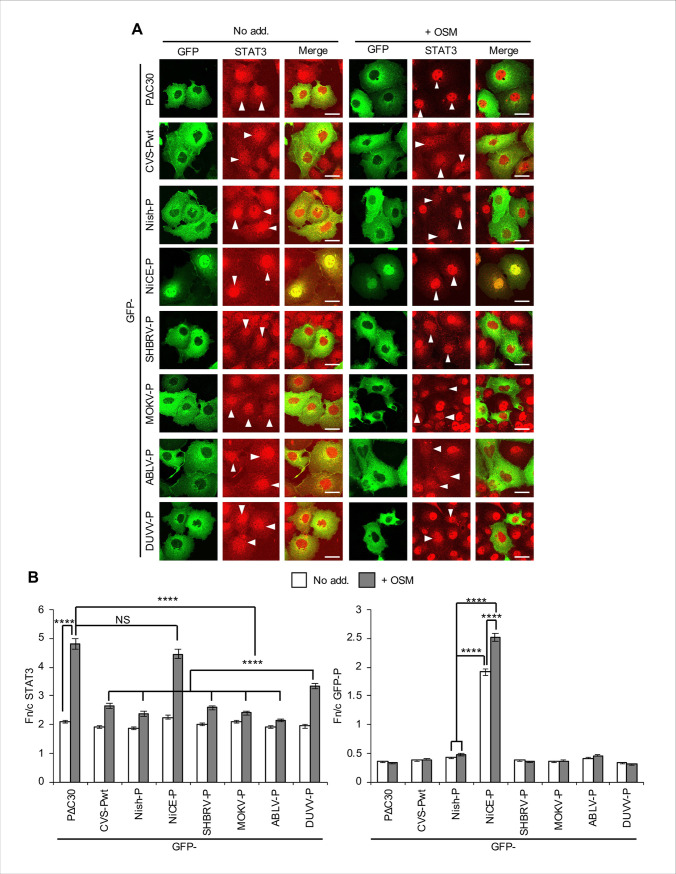
Fig 1. P-proteins from diverse lyssaviruses inhibit STAT3 responses to OSM.
(A) COS7 cells transfected to express the indicated proteins were treated 24 h post-transfection with or without (No add.) OSM (10 ng/ml, 15 min) before fixation, immunofluorescent staining for STAT3 (red) and analysis by CLSM. Representative images are shown. Arrowheads indicate cells with detectable expression of the transfected protein. Scale bars, 30 μm. (B) Images such as those shown in A were analysed to calculate the ratio of nuclear to cytoplasmic fluorescence (Fn/c) for STAT3 (left panel) and P-proteins (right panel) in GFP-positive cells; histograms show mean ± standard error of the mean (SEM; n ≥ 47 cells for each condition; results are from a single assay representative of three independent assays). Statistical analysis used Student’s t test. ****, p < 0.0001; NS, not significant; No add., no addition. Cells lacking detectable expression of the transfected protein were also analysed to determine the Fn/c for STAT3 as an internal negative control (see S1 Fig).

