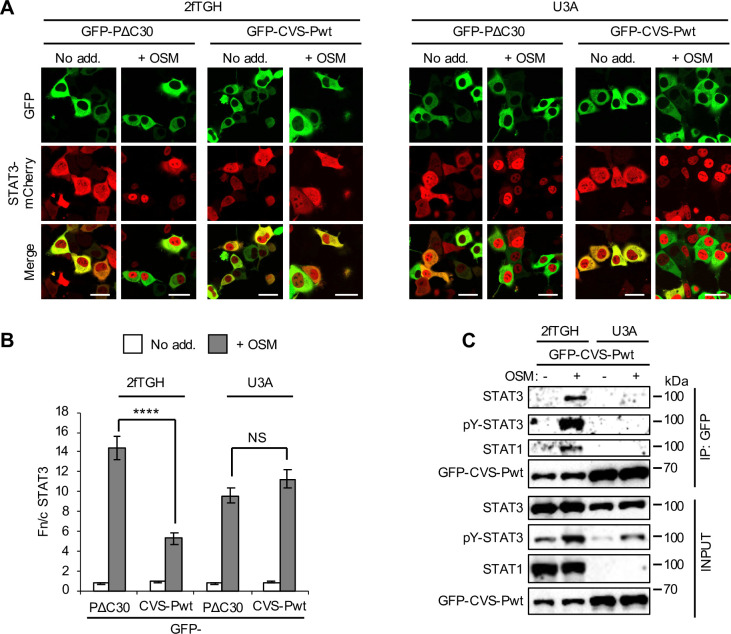
Fig 5. RABV P-protein does not interact with STAT3 in STAT1-deficient U3A cells.
(A,B) 2fTGH and U3A cells co-transfected to express the indicated proteins were treated with or without OSM before live-cell CLSM (A) to determine the Fn/c for STAT3-mCherry (B; mean ± SEM; n > 71 cells for each condition; results are from a single assay representative of two independent assays), as described in the legend to Fig 2. Scale bars, 30 μm. Statistical analysis used Student’s t test. ****, p < 0.0001; NS, not significant. (C) 2fTGH and U3A cells transfected to express GFP-CVS-Pwt were treated with or without OSM before immunoprecipitation of GFP and analysis by IB using antibodies against the indicated proteins, as described in the legend to Fig 3. Results are representative of 3 independent assays.

